
|
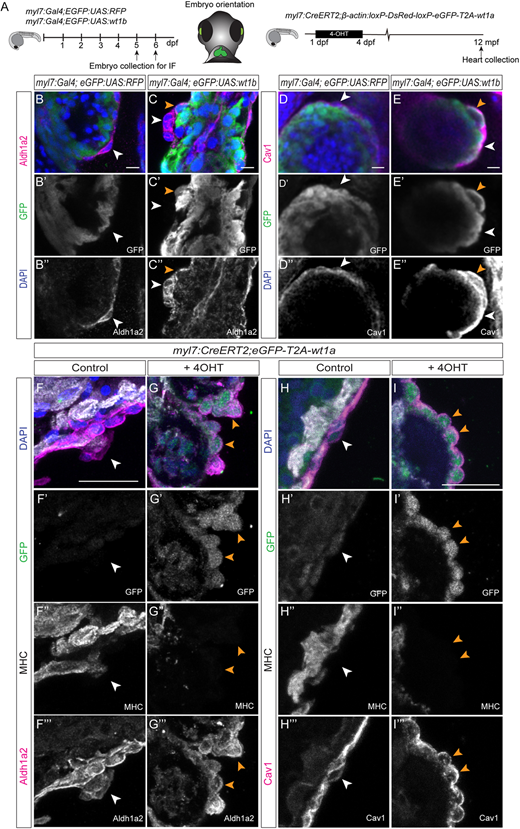
Fig. 3 Delaminated wt1a or wt1b-overexpressing cardiomyocytes start to express epicardial markers. (A) Schematic representation of the lines used and the time points during which 4-hydroxytamoxifen (4-OHT) was administered to myl7:CreERT2;β-actin:loxP-DsRed-loxP-eGFP-T2A-wt1a fish (in short, myl7:CreERT2,eGFP-T2A-wt1a), as well as embryo orientation for image acquisition. (B-C″) Whole-mount immunofluorescence against GFP and Aldh1a2 in myl7:Gal4;eGFP:UAS:RFP (B-B″) and myl7:Gal4;eGFP:UAS:wt1b (C-C″) embryos, at 5 days post-fertilization (dpf). Maximum intensity projections of five images with a distance of 1.5 µm between two consecutive optical sections are shown. White arrowheads mark cells positive for Aldh1a2. Orange arrowheads indicate cells that are positive for both GFP and Aldh1a2. Green, GFP; magenta, Aldh1a2; blue, DAPI. (D-E″) Whole-mount immunofluorescence against GFP and caveolin 1 (Cav1) in myl7:Gal4;eGFP:UAS:RFP (D-D″) and myl7:Gal4;eGFP:UAS:wt1b (E-E″) embryos at 6 dpf. Maximum intensity projections of 10 consecutive optical sections with a distance of 1.5 µm between them. White arrowheads highlight epicardial cells positive for Cav1 and negative for GFP. Orange arrowheads indicate epicardial cells that express both Cav1 and GFP. Green, GFP; magenta, Cav1; blue, DAPI. (F-G‴) Immunofluorescence against GFP (green), MHC (white) and Aldh1a2 (magenta) on paraffin wax-embedded sections of myl7:CreERT2;eGFP-T2A-wt1a and myl7:CreERT2;eGFP-T2A-wt1a+4-OHT adult hearts. Detailed views of heart sections in the atrium are shown. Both merged and single channels are shown, as indicated in the panel. White arrowheads indicate cells positive for Aldh1a2 only. Orange arrowheads indicate cells positive for GFP and Aldh1a2 signal that lack MHC staining, and that are located close to the myocardial surface. (H-I‴) Immunofluorescence against GFP (green), MHC (white) and caveolin 1 (Cav1) (magenta) on paraffin wax-embedded sections of myl7:CreERT2;eGFP-T2A-wt1a and myl7::CreERT2;eGFP-T2A-wt1a+4-OHT adult hearts. Detailed views of heart sections in the atrium are shown. Both merged and single channels are shown, as indicated in the panel. White arrowheads indicate cells positive only for Cav1. Orange arrowheads indicate cells positive for GFP and Cav1 signal that lack MHC staining, and that are located close to the myocardial surface. Scale bars: 10 µm in B-E″; 25 µm in F-I‴. Cav1, caveolin 1; MHC, myosin heavy chain.