
Fig. 2
- ID
- ZDB-FIG-231215-168
- Publication
- Marques et al., 2022 - WT1 transcription factor impairs cardiomyocyte specification and drives a phenotypic switch from myocardium to epicardium
- Other Figures
- All Figure Page
- Back to All Figure Page
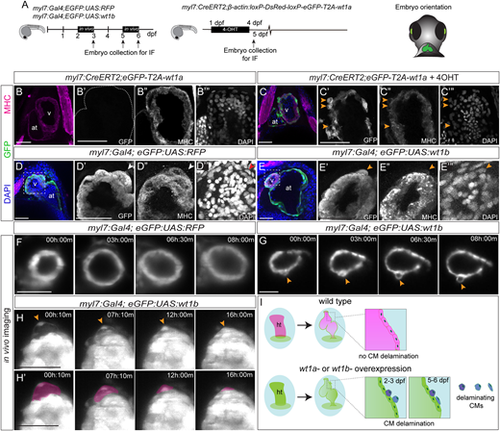
Ventricular cardiomyocytes delaminate from the ventricle and change their fate upon wt1a or wt1b overexpression. (A) Schematic representation of transgenic lines used and position of the embryos for imaging. (B-C‴) Whole-mount immunofluorescence against GFP (green) and MHC (magenta) on myl7:CreERT2,eGFP-T2A-wt1a hearts at 5 days post-fertilization (dpf): non-recombined (B-B‴) and recombined by addition of 4-OHT (C-C‴) between 1 and 4 dpf. Maximum intensity projections of five optical sections with 1.5 µm between two consecutive sections are shown. Arrowheads indicate GFP-positive cardiomyocytes located on the apical myocardial surface, revealing reduced MHC staining. (D-E‴) Whole-mount immunofluorescence against GFP and MHC on a myl7:Gal4;eGFP:UAS:RFP (D-D‴) and a myl7:Gal4;eGFP:UAS:wt1b (E-E‴) embryo at 3 dpf. DAPI was used for nuclear counterstain. Maximum intensity projections of 20 stacks with a distance of 1 µm between two consecutive optical sections of the heart region are shown. (D′-D‴ and E′-E‴) Detailed views of the area of the ventricle indicated in D and E, respectively. Arrowheads indicate a GFP-positive cell that is MHC+ in D′-D‴ and a GFP+/MHC− cell in E′-E‴, and an epicardial cell in the myl7:Gal4;eGFP:UAS:RFP control heart, negative for both GFP and MHC. (F,G) Time-lapse images of the ventricle in a myl7:Gal4;eGFP:UAS:RFP (F) or a myl7:Gal4;eGFP:UAS:wt1b (G) embryo between 2 and 3 dpf. Elapsed time since initial acquisition is indicated in each panel. Arrowheads indicate a cell extruding from the ventricle. (H,H′) Time-lapse images of the ventricle in a myl7:Gal4;eGFP:UAS:wt1b embryo between 5 and 6 dpf. Elapsed time since initial acquisition is indicated in each panel. Delaminating cells change morphology over time and flatten down (arrowheads). In H′, the flattening cells are highlighted in magenta. (I) Model of the delamination process of wt1a or wt1b-overexpressing cardiomyocytes. Scale bars: 50 µm. at, atrium; CM, cardiomyocyte; ht, heart tube; IF, immunofluorescence; v, ventricle. |