
|
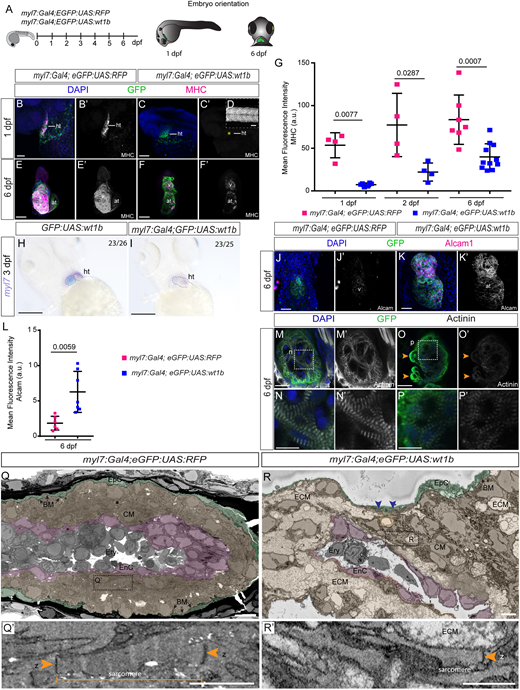
Fig. 5 Changes in cardiomyocyte maturation and structure upon wt1b overexpression. (A) Schematic representation of the lines used and embryo orientation for staining and imaging. (B-F′) Immunofluorescence against GFP and myosin heavy chain (MHC) on myl7:Gal4;eGFP:UAS:RFP and myl7:Gal4;eGFP:UAS:wt1b zebrafish embryos. (B-C′) 3D projection of 1 day post-fertilization (dpf) embryos. Lateral views of the cardiac tube. Asterisk in C′ indicates the heart, where MHC is absent. (D) MHC staining of the myotome region of the myl7:Gal4;eGFP:UAS:wt1b embryo. (E-F′) 3D projections of the heart region at 6 dpf. Ventral views are shown; the head is to the top. (G) Quantification of mean fluorescence intensity in the heart region for myl7:Gal4;eGFP:UAS:RFP and myl7:Gal4;eGFP:UAS:wt1b zebrafish, at indicated developmental stages. Statistical significance was calculated by an unpaired t-test with Welch's correction (24 hpf) and by unpaired t-test for the remaining group comparisons. Data are mean±s.d. with each point representing a single biological replicate. (H,I) Whole-mount mRNA in situ hybridization against myl7 mRNA in (H) eGFP:UAS:wt1b and (I) myl7:Gal4;eGFP:UAS:wt1b zebrafish embryos at 3 dpf. Embryos are positioned ventrally, with the head towards the top. (J-K′) Immunofluorescence against GFP and Alcam on myl7:Gal4;eGFP:UAS:RFP and myl7:Gal4;eGFP:UAS:wt1b zebrafish embryos. 3D projections of the heart region in a 6 dpf larva (ventral views; the head is towards the top). (L) Quantification of mean fluorescence intensity of anti-Alcam staining as shown in J-K′. Statistical significance was calculated using an unpaired t-test with Welch's correction. Data are mean±s.d. with each point representing a single biological replicate. (M-P′) Immunofluorescence against GFP and α-actinin. Maximum intensity projections of two consecutive optical sections with a step size of 1.5 µm of the ventricle of myl7:Gal4;eGFP:UAS:RFP (M-N′) and myl7:Gal4;eGFP:UAS:wt1b (O-P′) at 6 dpf. (N,N′ and P,P′) Maximum intensity projections regions outlined in M and O, respectively. (Q-R′) Serial block face scanning electron microscope images of zebrafish hearts. Single sections of myl7:Gal4;eGFP:UAS:RFP (Q,Q′) and myl7:Gal4;eGFP:UAS:wt1b (R,R′) hearts are shown. Different cell layers are highlighted with colors. (Q′ and R′) Detailed views of the areas outlined in Q and R highlighting sarcomeres. Green labels the epicardium; magenta marks the endocardial layer; orange/brown highlights the myocardium. Orange arrowheads indicate z-bands; blue arrowheads indicate basement membrane delimiting epicardium and myocardium. Scale bars: 50 µm in B-F′,H-M′,O,O′; 1 µm in Q,R; 500 nm in Q′,R′; 10 µm in N,N′,P,P′. at, atrium; BM, basement membrane; CM, cardiomyocyte; ECM, extracellular matrix; EnC, endothelial cell; EpC, epicardial cell; Ery, erythrocyte; v, ventricle; z, z-line. Green, GFP; magenta, MHC, Alcam; blue, DAPI.