
|
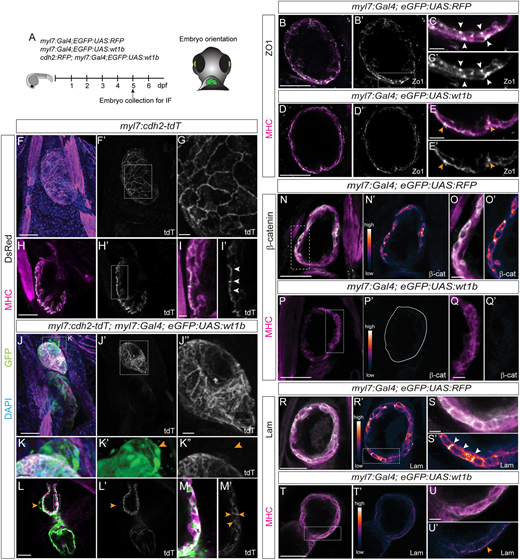
Fig. 4 Changes in cell adhesion and cell polarity upon wt1b overexpression in the myocardium. (A) Schematic representation of the lines used, the time of fixation and embryo orientation for imaging. (B-E′) Immunofluorescence against zonula occludens 1 (ZO-1) and myosin heavy chain (MHC) in myl7:Gal4;eGFP:UAS:RFP (B-C′) and myl7:Gal4;eGFP:UAS:wt1b (D-E′) embryos. Sagittal single planes of the ventricle of merged and single channels as marked in the panels. (C,C′ and E,E′) Detailed views of the regions outlined in B′ and D′, respectively. Arrowheads indicate ZO1 signal. (F-M′) Immunofluorescence against tdTomato (tdT) (using a DsRed antibody) and MHC in myl7:cdh2-tdTomato (F-I′) and myl7:cdh2-tdTomato;myl7:Gal4;eGFP:UAS:wt1b (J-M′) embryos. (F-G) 3D projections of a heart. (G) Detailed view of the region outlined in F′. (H-I′) Sagittal single planes of the ventricle. (I,I′) Detailed views of the region outlined in H′. Arrowheads indicate regions with tdT signal. (J-K″) 3D projections of a heart. (J″) Detailed view of the region outlined in J′. (K-K″) Detailed views of the region outlined in J. Arrowheads indicate delaminating cells from the ventricle. tdT signal is not present in the delaminated cells (K″). (L-M′) Sagittal single planes of the ventricle. (M,M′) Detailed views of the region outlined in L. Arrowheads indicate tdT signal. (N-Q′) Immunofluorescence against β-catenin (β-cat) and MHC in myl7:Gal4;eGFP:UAS:RFP (N-O′) and myl7:Gal4;eGFP:UAS:wt1b (P-Q′) embryos. Sagittal single planes of the ventricle of merged and single channels, as indicated in the panels. LUT color shows gradient of β-cat signal intensity. (O,O′ and Q,Q′) Detailed views of the regions outlined in N and P, respectively. Region marked in P′ indicates the ventricle. (R-U′) Immunofluorescence against laminin (Lam) and MHC in myl7:Gal4;eGFP:UAS:RFP (R-S′) and myl7:Gal4;eGFP:UAS:wt1b (T-U′) embryos. Sagittal single planes of the ventricle of merged and single channels, as indicated in the panels. LUT color shows gradient of laminin signal intensity. (S,S′ and U,U′) Detailed views of the regions outlined in R′ and T, respectively. Arrowheads indicate laminin signal. Scale bars: 50 µm in B,B′,D,D′,F,F′,H,H′,J,J′,L,L′,N,N′,P,P′,R,R′,T,T′; 10 µm in C,C′,E,E′,G,I,I′,J″,K-K″,M,M′,O,O′,Q,Q′,S,S′,U,U′. dpf, days post-fertilization; IF, immunofluorescence.