
FIGURE SUMMARY
- Title
-
Zebrafish Mutant Lines Reveal the Interplay between nr3c1 and nr3c2 in the GC-Dependent Regulation of Gene Transcription
- Authors
- Dinarello, A., Tesoriere, A., Martini, P., Fontana, C.M., Volpato, D., Badenetti, L., Terrin, F., Facchinello, N., Romualdi, C., Carnevali, O., Dalla Valle, L., Argenton, F.
- Source
- Full text @ Int. J. Mol. Sci.
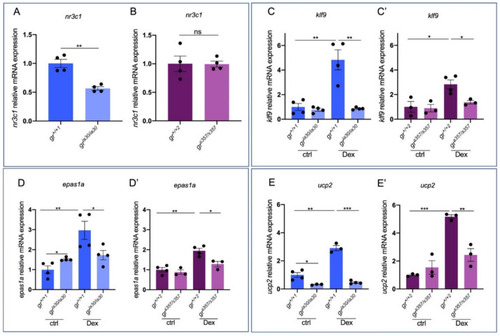
Figure 1. GR direct target genes show slight differences of expression between gria30 and grs357 mutant lines. (A) RT-qPCR analysis of nr3c1 in 6 dpf gr+/+1 and gria30/ia30 larvae. (B) RT-qPCR analysis of nr3c1 in 6 dpf gr+/+2 and grs357/s357 larvae. (C) RT-qPCR analysis of klf9 in 6 dpf gr+/+1 and gria30/ia30 (C) and in gr+/+2 and grs357/s357 (C’) larvae with or without Dex treatment. (D) RT-qPCR analysis of epas1a in 6 dpf gr+/+1 and gria30/ia30 (D) and in gr+/+2 and grs357/s357 (D’) larvae with or without Dex treatment. (E) RT-qPCR analysis of ucp2 in 6 dpf gr+/+1 and gria30/ia30 (E) and in gr+/+2 and grs357/s357 (E’) larvae with or without Dex treatment. Statistical analyses were performed with Student’s t test. Mean ± SEM. * p < 0.05; ** p < 0.01; *** p < 0.001.
|
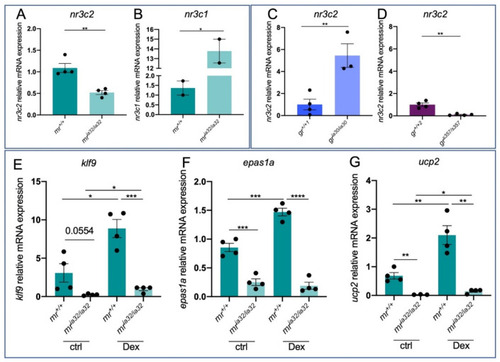
Figure 2. Analysis of GC-dependent genes in mr mutant zebrafish larvae. (A) RT-qPCR analysis of nr3c2 in 6 dpf mr+/+ and mria32/ia32. (B) RT-qPCR analysis of nr3c1 in 6 dpf mr+/+ and mria32/ia32. (C) RT-qPCR analysis of nr3c2 in 6 dpf gr+/+ and gria30/ia30. (D) RT-qPCR analysis of nr3c2 in 6 dpf gr+/+ and grs357/s357. (E) RT-qPCR analysis of klf9 in 6 dpf mr+/+ and mria32/iaq32 larvae with or without Dex treatment. (F) RT-qPCR analysis of epas1a in 6 dpf mr+/+ and mria32/ia32 larvae with or without Dex treatment. (G) RT-qPCR analysis of ucp2 in 6 dpf mr+/+ and mria32/ia32 larvae with or without Dex treatment. Statistical analyses were performed with Student’s t test. Mean ± SEM. * p < 0.05; ** p < 0.01; *** p < 0.001; **** p < 0.0001.
|
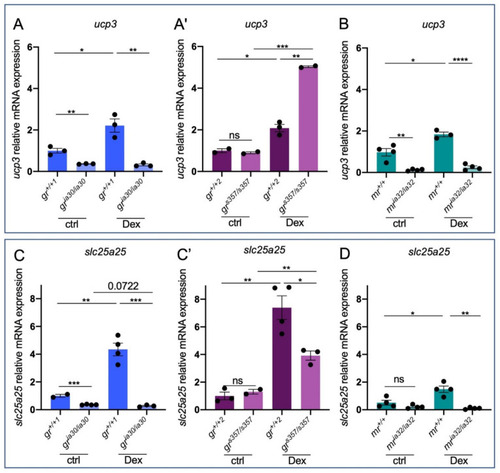
Figure 3. GC-dependent genes reveal different expression levels in the two nr3c1 zebrafish mutant lines. (A) RT-qPCR analysis of ucp3 in 6 dpf gr+/+1 and gria30/ia30 (A) and in gr+/+2 and grs357/s357 (A’) larvae with or without Dex treatment. (B) RT-qPCR analysis of ucp3 in 6 dpf mr+/+ and mria32/ia32 larvae with or without Dex treatment. (C) RT-qPCR analysis of slc25a25 in 6 dpf gr+/+1 and gria30/ia30 (C) and in gr+/+2 and grs357/s357 (C’) larvae with or without Dex treatment. (D) RT-qPCR analysis of slc25a25 in 6 dpf mr+/+ and mria32/ia32 larvae with or without Dex treatment. Statistical analyses were performed with Student’s t test. Mean ± SEM. * p < 0.05; ** p < 0.01; *** p < 0.001; **** p < 0.0001; ns = not significant.
|
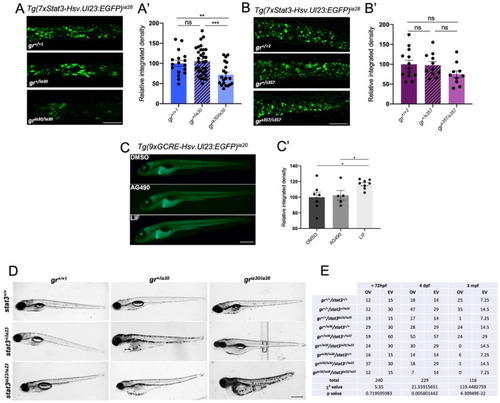
Figure 4. Analysis of crosstalk between GR and Stat3 with zebrafish mutant and transgenic lines. (A) Representative pictures (A) and fluorescence quantification (A’) of Tg(7xStat3-Hsv.Ul23:EGFP)ia28 6 dpf larvae at the level of the intestine in gr+/+1, gr+/ia30 and gria30/ia30 genetic background. Scale bar= 100 μm. (B) Representative pictures (B) and fluorescence quantification (B’) of Tg(7xStat3-Hsv.Ul23:EGFP)ia28 6 dpf larvae at the level of the intestine in gr+/+2, gr+/s357 and grs357/s357 genetic background. Scale bar = 100 μm. (C) Representative pictures (C) and fluorescence quantification (C’) of Tg(9xGCRE-Hsv.Ul23:EGFP)ia20 incubated from 3 to 6 dpf with DMSO, 50 μM AG490 and 20 μM LIF. Scale bar = 500 μm. (D) representative pictures of 6 dpf larvae generated by the breeding between gr+/ia30/stat3+/ia23 zebrafish. Scale bar = 500 μm. (E) Table of observed (OV) and expected (EV) values of animals belonging to the 9 different genotypes obtained from breedings between gr+/ia30/stat3+/ia23 zebrafish: χ2 test shows not significant differences between OV and EV in genotype distribution until 72 hpf (p-value = 0.7196); significant differences between OV and EV were detected at 4 dpf (** p-value = 0.0058) and 3 mpf (**** p-value = 4.30949 × 10⁻²²). Mean ± SEM. Statistical analyses were performed with Student’s t test (A,B,C) and χ2 test (E). * p < 0.05; ** p < 0.01; *** p < 0.001; ns = not significant.
|
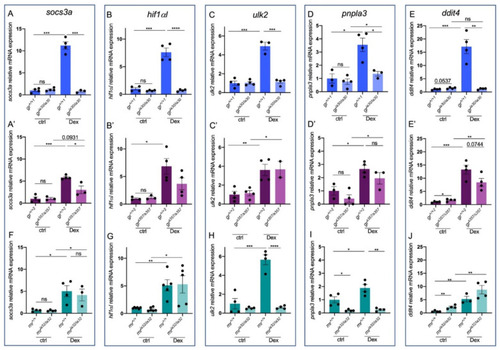
Figure 5. Stat3-dependent genes are differentially expressed in gria30 and grs357 mutant lines. (A) RT-qPCR analysis of socs3a in 6 dpf gr+/+ and gria30/ia30 (A) and in gr+/+ and grs357/s357 (A’) larvae with or without Dex treatment. (B) RT-qPCR analysis of hif1αl in 6 dpf gr+/+ and gria30/ia30 (B) and in gr+/+ and grs357/s357 (B’) larvae with or without Dex treatment. (C) RT-qPCR analysis of ulk2 in 6 dpf gr+/+ and gria30/ia30 (C) and in gr+/+ and grs357/s357 (C’) larvae with or without Dex treatment. (D) RT-qPCR analysis of pnpla3 in 6 dpf gr+/+ and gria30/ia30 (D) and in gr+/+ and grs357/s357 (D’) larvae with or without Dex treatment. (E) RT-qPCR analysis of ddit4 in 6 dpf gr+/+ and gria30/ia30 (E) and in gr+/+ and grs357/s357 (E’) larvae with or without Dex treatment. (F) RT-qPCR analysis of socs3a in 6 dpf mr+/+ and mria32/ia32 larvae with or without Dex treatment. (G) RT-qPCR analysis of hif1αl in 6 dpf mr+/+ and mria32/ia32 larvae with or without Dex treatment. (H) RT-qPCR analysis of ddit4 in 6 dpf mr+/+ and mria32/ia32 larvae with or without Dex treatment. (I) RT-qPCR analysis of ulk2 in 6 dpf mr+/+ and mria32/ia32 larvae with or without Dex treatment. (J) RT-qPCR analysis of pnpla3 in 6 dpf mr+/+ and mria32/ia32 larvae with or without Dex treatment. Statistical analyses were performed with Student’s t test. Mean ± SEM. * p < 0.05; ** p< 0.01; *** p < 0.001; **** p < 0.0001; ns = not significant.
|
Acknowledgments
This image is the copyrighted work of the attributed author or publisher, and
ZFIN has permission only to display this image to its users.
Additional permissions should be obtained from the applicable author or publisher of the image.
Full text @ Int. J. Mol. Sci.