
IMAGE
Figure 5
Image
|
Figure Caption
Figure 5
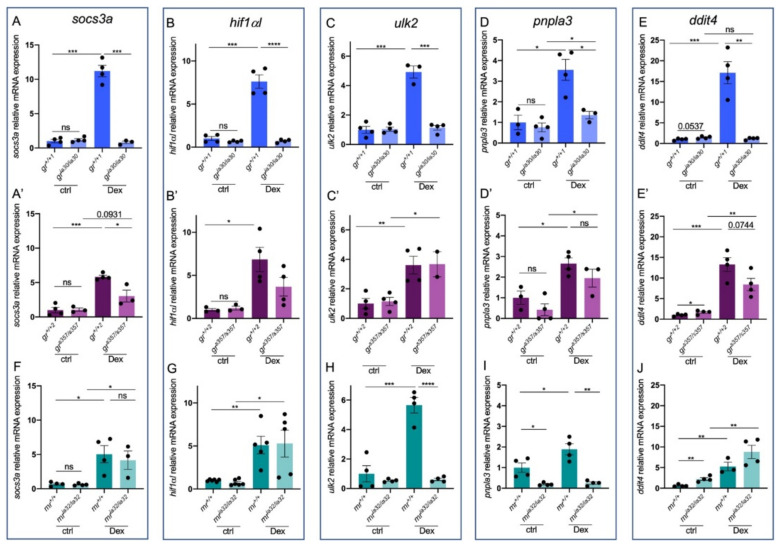
Figure 5. Stat3-dependent genes are differentially expressed in gria30 and grs357 mutant lines. (A) RT-qPCR analysis of socs3a in 6 dpf gr+/+ and gria30/ia30 (A) and in gr+/+ and grs357/s357 (A’) larvae with or without Dex treatment. (B) RT-qPCR analysis of hif1αl in 6 dpf gr+/+ and gria30/ia30 (B) and in gr+/+ and grs357/s357 (B’) larvae with or without Dex treatment. (C) RT-qPCR analysis of ulk2 in 6 dpf gr+/+ and gria30/ia30 (C) and in gr+/+ and grs357/s357 (C’) larvae with or without Dex treatment. (D) RT-qPCR analysis of pnpla3 in 6 dpf gr+/+ and gria30/ia30 (D) and in gr+/+ and grs357/s357 (D’) larvae with or without Dex treatment. (E) RT-qPCR analysis of ddit4 in 6 dpf gr+/+ and gria30/ia30 (E) and in gr+/+ and grs357/s357 (E’) larvae with or without Dex treatment. (F) RT-qPCR analysis of socs3a in 6 dpf mr+/+ and mria32/ia32 larvae with or without Dex treatment. (G) RT-qPCR analysis of hif1αl in 6 dpf mr+/+ and mria32/ia32 larvae with or without Dex treatment. (H) RT-qPCR analysis of ddit4 in 6 dpf mr+/+ and mria32/ia32 larvae with or without Dex treatment. (I) RT-qPCR analysis of ulk2 in 6 dpf mr+/+ and mria32/ia32 larvae with or without Dex treatment. (J) RT-qPCR analysis of pnpla3 in 6 dpf mr+/+ and mria32/ia32 larvae with or without Dex treatment. Statistical analyses were performed with Student’s t test. Mean ± SEM. * p < 0.05; ** p< 0.01; *** p < 0.001; **** p < 0.0001; ns = not significant.
Figure Data
Acknowledgments
This image is the copyrighted work of the attributed author or publisher, and
ZFIN has permission only to display this image to its users.
Additional permissions should be obtained from the applicable author or publisher of the image.
Full text @ Int. J. Mol. Sci.