
Image
|
Figure Caption
Figure 4
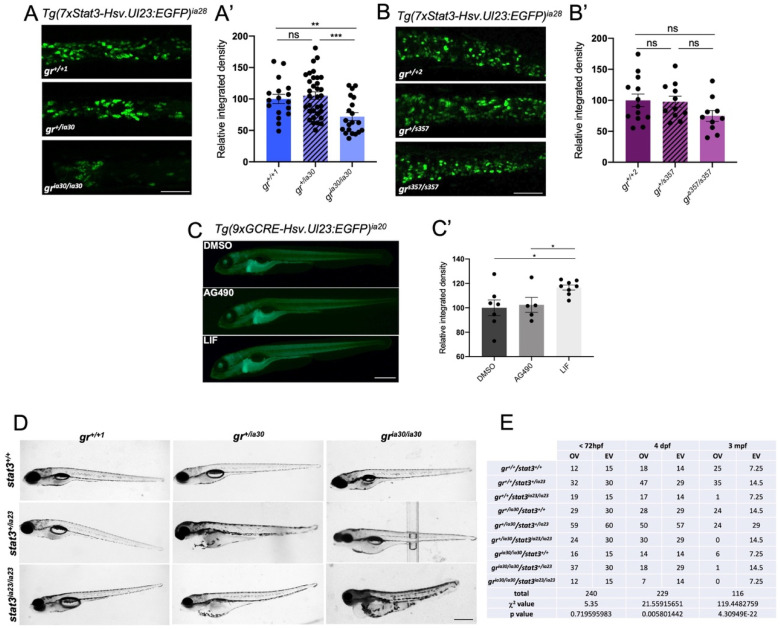
Figure 4. Analysis of crosstalk between GR and Stat3 with zebrafish mutant and transgenic lines. (A) Representative pictures (A) and fluorescence quantification (A’) of Tg(7xStat3-Hsv.Ul23:EGFP)ia28 6 dpf larvae at the level of the intestine in gr+/+1, gr+/ia30 and gria30/ia30 genetic background. Scale bar= 100 μm. (B) Representative pictures (B) and fluorescence quantification (B’) of Tg(7xStat3-Hsv.Ul23:EGFP)ia28 6 dpf larvae at the level of the intestine in gr+/+2, gr+/s357 and grs357/s357 genetic background. Scale bar = 100 μm. (C) Representative pictures (C) and fluorescence quantification (C’) of Tg(9xGCRE-Hsv.Ul23:EGFP)ia20 incubated from 3 to 6 dpf with DMSO, 50 μM AG490 and 20 μM LIF. Scale bar = 500 μm. (D) representative pictures of 6 dpf larvae generated by the breeding between gr+/ia30/stat3+/ia23 zebrafish. Scale bar = 500 μm. (E) Table of observed (OV) and expected (EV) values of animals belonging to the 9 different genotypes obtained from breedings between gr+/ia30/stat3+/ia23 zebrafish: χ2 test shows not significant differences between OV and EV in genotype distribution until 72 hpf (p-value = 0.7196); significant differences between OV and EV were detected at 4 dpf (** p-value = 0.0058) and 3 mpf (**** p-value = 4.30949 × 10⁻²²). Mean ± SEM. Statistical analyses were performed with Student’s t test (A,B,C) and χ2 test (E). * p < 0.05; ** p < 0.01; *** p < 0.001; ns = not significant.
Figure Data
Acknowledgments
This image is the copyrighted work of the attributed author or publisher, and
ZFIN has permission only to display this image to its users.
Additional permissions should be obtained from the applicable author or publisher of the image.
Full text @ Int. J. Mol. Sci.