
- Title
-
Allele-specific gene expression can underlie altered transcript abundance in zebrafish mutants
- Authors
- White, R.J., Mackay, E., Wilson, S.W., Busch-Nentwich, E.M.
- Source
- Full text @ Elife
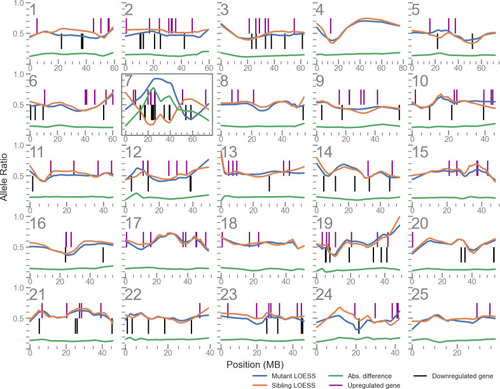
The plots for each of the 25 chromosomes shows the allele balance (proportion of reads containing the alternative allele) of each single nucleotide polymorphism (SNP) locus along with its physical position. The blue and orange lines are LOESS-smoothed averages of the data. The green line is the absolute difference of the mutant and sibling samples and is used to identify the region of highest LD. Vertical lines indicate the position of differentially expressed genes.
|
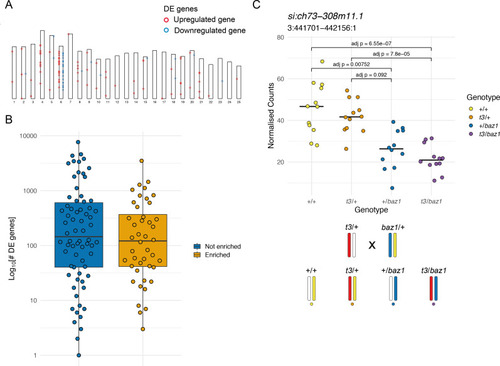
(A) Ideogram showing the locations of the DE genes in a mitfaw2 incross. Circles represent DE genes and are coloured red if the gene is upregulated in the mutant embryos and blue if it is downregulated. (B) Distribution of the total number of DE genes in experiments according to whether there is an enrichment on the mutant chromosome (orange) or not (blue), plotted on a log10 scale. (C) Plot of normalised counts according to genotype in an intercross of two different sox10 alleles. Yellow = wild type (+/+), orange = sox10 t3 heterozygotes (t3/+), blue = sox10 baz1 heterozygotes (+/baz1), purple = sox10 t3, baz1 compound heterozygotes (t3/baz1). The schematic below the plot shows the chromosomes contributing to each genotype. Embryos that share the wild-type allele inherited from the baz1/+ parent (yellow chromosome) show higher expression levels.
|
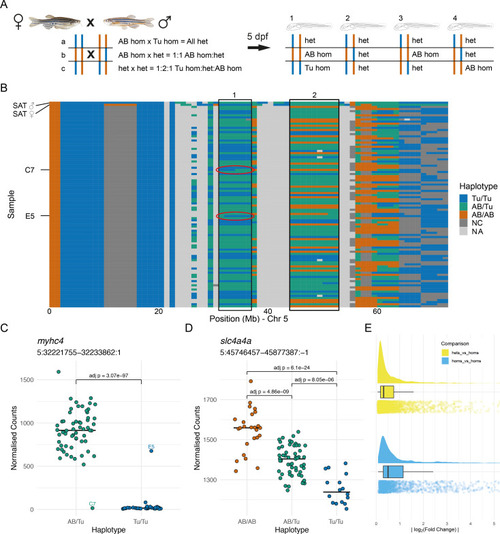
(A) Experimental design. Two wild-type SAT fish were incrossed and 96 embryos were collected for RNA-sequencing (RNA-seq) at 5 days post-fertilisation (dpf). Depending on the haplotypes of the parents, different combinations of genotype are possible in specific regions in the offspring. (B) The haplotypes of the collected embryos were determined in 1 Mbp bins using the RNA-seq reads and the embryos were grouped according to the haplotypes in specific regions. Chromosome 5 is shown with chromosomal position along the x-axis and samples on the y-axis. 1 Mbp bins are coloured according to the haplotype in that region. Blue = homozygous Tübingen (Tu/Tu), green = heterozygous AB/Tübingen (AB/Tu), orange = homozygous AB (AB/AB), dark grey = not consistent with parental haplotypes (NC), light grey = no haplotype call (NA), due to, for example, low coverage. Examples of regions used to group the embryos are boxed. Red ovals indicate regions containing recombination breakpoints in the samples labelled in (C). (C–D) Examples of differentially expressed genes from two different groupings. (C) Counts for the myhc4 gene, grouped according to the haplotypes in the region 5:31–37 Mbp (region 1 in B). The Tübingen allele is expressed at very low levels, with much higher expression in the heterozygotes. There are two examples of embryos with recombinations within the region. Compare to red ovals in the haplotype plot in (B). (D) Example of a differentially expressed gene (slc4a4a) in a region where all three genotypes are present (5:44–53 Mbp, region 2 in B). As in (C), the Tübingen allele has lower expression, with the heterozygotes showing intermediate levels. (E) Distribution of absolute log2(fold change) values found between wild-type alleles. Differences when comparing homozygous embryos (blue) are generally larger than when comparing heterozygotes to homozygotes (yellow).
|
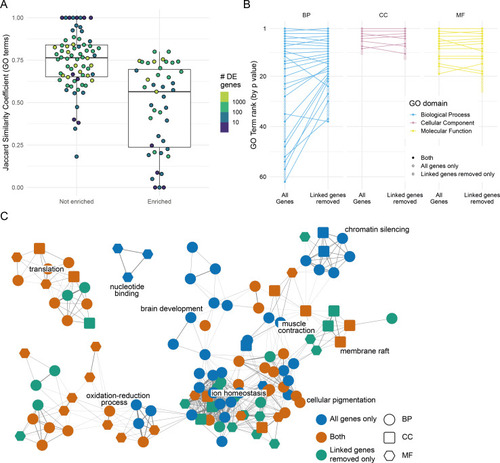
(A) Distribution of the overlap between the Gene Ontology (GO) terms enriched when DE genes linked to the mutation are removed. GO term enrichment was done on both the DE gene list and the list with the genes on the same chromosome as the mutation removed (excluding the mutated gene itself). The lists of enriched GO terms were then compared and the Jaccard similarity coefficient (number of GO terms enriched in both sets/total number of enriched GO terms) calculated. Each point represents one experiment. Experiments are split according to whether the chromosome with the mutated gene has an enrichment of DE genes or not. Points are coloured by the number of DE genes identified in the experiment (log10 scale). (B) Plot showing the changes in GO term enrichment for a single experiment (sox10t3/baz1 incross at 36 hr post-fertilisation). Each point is an enriched GO term ranked by p-value (highest ranked terms at the top) and the lines connect the same terms if they are enriched using both gene lists (all genes or genes linked to the mutation removed). Unconnected points are terms that are only enriched for either the ‘all genes’ list (open circles) or for the ‘linked genes removed list’ (open squares). (C) Network diagram representation of the same GO enrichments as in (B). Each node represents a GO term, and the nodes are connected by an edge if the genes annotated to the term overlap sufficiently (Cohen’s kappa > 0.4). GO term nodes are coloured by whether they are enriched in both lists (orange) or just one (blue = all genes only, green = linked genes removed only). The shape of the nodes represents the GO term domain of the term (circle = biological process, square = cellular component, hexagon = molecular function).
|
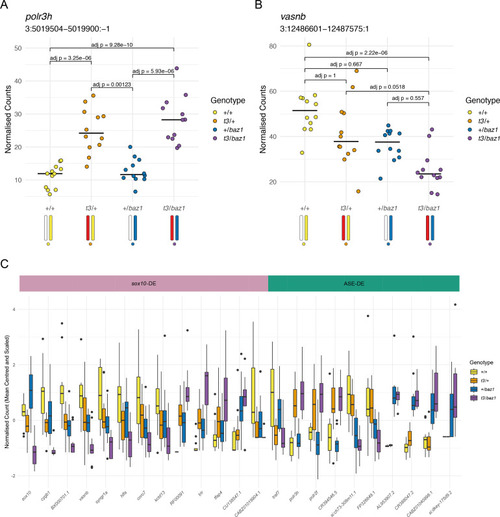
(A) Plot of normalised counts consistent with ASE. This shows either reduced expression from the allele on one of the wild-type chromosomes (white chromosome in the diagram under the plot) or increased expression from the allele on the t3 chromosome (red chromosome). Yellow = wild-types (+/+), orange = t3 heterozygotes (t3/+), blue = baz1 heterozygotes (+/baz1), purple = compound heterozygotes (t3/baz1). (B) Normalised counts consistent with a response to the sox10 mutations. The compound heterozygotes have reduced expression and the other two groups of heterozygotes are intermediate between the compound heterozygotes and the wild types. (C). Boxplots of the expression of all the differentially expressed (DE) genes on chromosome 3. These are split into two groups, those that are consistent with being downstream of sox10 (sox10-DE) and those that appear to be driven by allele-specific expression unrelated to sox10 (ASE-DE).
|