
Figure 5
- ID
- ZDB-FIG-220303-59
- Publication
- White et al., 2022 - Allele-specific gene expression can underlie altered transcript abundance in zebrafish mutants
- Other Figures
- All Figure Page
- Back to All Figure Page
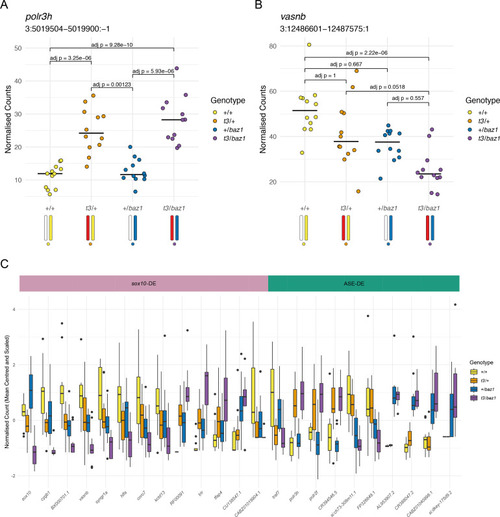
(A) Plot of normalised counts consistent with ASE. This shows either reduced expression from the allele on one of the wild-type chromosomes (white chromosome in the diagram under the plot) or increased expression from the allele on the t3 chromosome (red chromosome). Yellow = wild-types (+/+), orange = t3 heterozygotes (t3/+), blue = baz1 heterozygotes (+/baz1), purple = compound heterozygotes (t3/baz1). (B) Normalised counts consistent with a response to the sox10 mutations. The compound heterozygotes have reduced expression and the other two groups of heterozygotes are intermediate between the compound heterozygotes and the wild types. (C). Boxplots of the expression of all the differentially expressed (DE) genes on chromosome 3. These are split into two groups, those that are consistent with being downstream of sox10 (sox10-DE) and those that appear to be driven by allele-specific expression unrelated to sox10 (ASE-DE).
|