
Figure 3
- ID
- ZDB-FIG-220303-31
- Publication
- White et al., 2022 - Allele-specific gene expression can underlie altered transcript abundance in zebrafish mutants
- Other Figures
- All Figure Page
- Back to All Figure Page
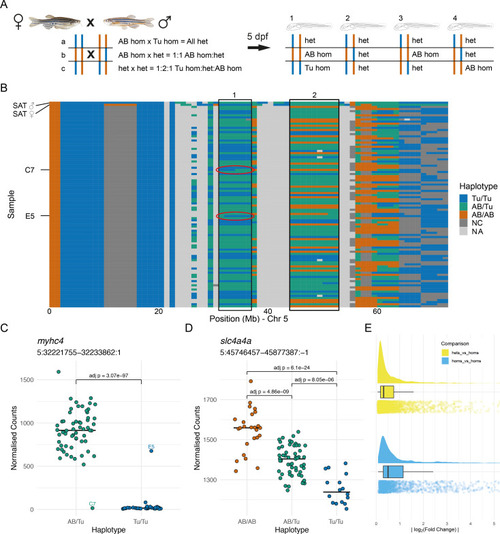
(A) Experimental design. Two wild-type SAT fish were incrossed and 96 embryos were collected for RNA-sequencing (RNA-seq) at 5 days post-fertilisation (dpf). Depending on the haplotypes of the parents, different combinations of genotype are possible in specific regions in the offspring. (B) The haplotypes of the collected embryos were determined in 1 Mbp bins using the RNA-seq reads and the embryos were grouped according to the haplotypes in specific regions. Chromosome 5 is shown with chromosomal position along the x-axis and samples on the y-axis. 1 Mbp bins are coloured according to the haplotype in that region. Blue = homozygous Tübingen (Tu/Tu), green = heterozygous AB/Tübingen (AB/Tu), orange = homozygous AB (AB/AB), dark grey = not consistent with parental haplotypes (NC), light grey = no haplotype call (NA), due to, for example, low coverage. Examples of regions used to group the embryos are boxed. Red ovals indicate regions containing recombination breakpoints in the samples labelled in (C). (C–D) Examples of differentially expressed genes from two different groupings. (C) Counts for the myhc4 gene, grouped according to the haplotypes in the region 5:31–37 Mbp (region 1 in B). The Tübingen allele is expressed at very low levels, with much higher expression in the heterozygotes. There are two examples of embryos with recombinations within the region. Compare to red ovals in the haplotype plot in (B). (D) Example of a differentially expressed gene (slc4a4a) in a region where all three genotypes are present (5:44–53 Mbp, region 2 in B). As in (C), the Tübingen allele has lower expression, with the heterozygotes showing intermediate levels. (E) Distribution of absolute log2(fold change) values found between wild-type alleles. Differences when comparing homozygous embryos (blue) are generally larger than when comparing heterozygotes to homozygotes (yellow).
|