
Figure 1.
- ID
- ZDB-IMAGE-220303-58
- Publication
- White et al., 2022 - Allele-specific gene expression can underlie altered transcript abundance in zebrafish mutants
- All Figures
- Figures for White et al., 2022
|
Figure 1.
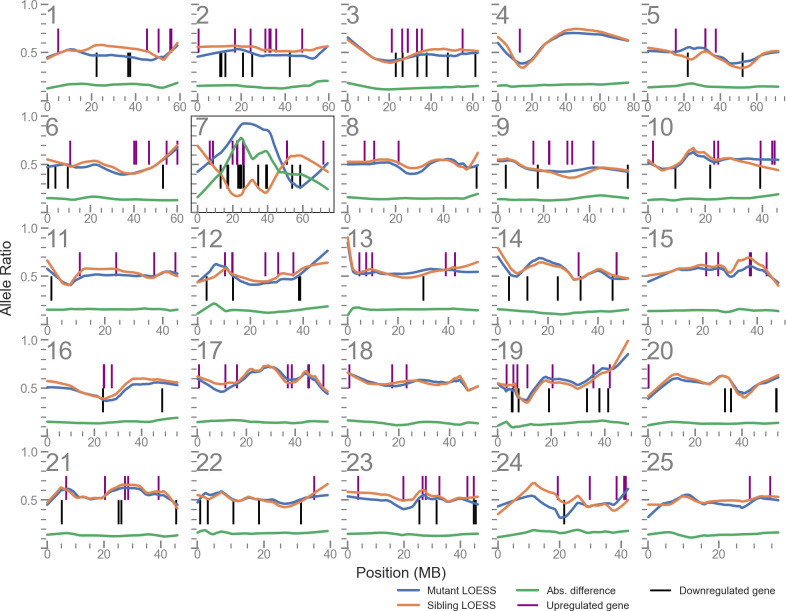
The plots for each of the 25 chromosomes shows the allele balance (proportion of reads containing the alternative allele) of each single nucleotide polymorphism (SNP) locus along with its physical position. The blue and orange lines are LOESS-smoothed averages of the data. The green line is the absolute difference of the mutant and sibling samples and is used to identify the region of highest LD. Vertical lines indicate the position of differentially expressed genes.
Linkage disequilibrium (LD) mapping plot of up- and downregulated genes in u426 mutants shows a cluster of such genes local to the mutation site on chromosome 7.