
|
Figure 2
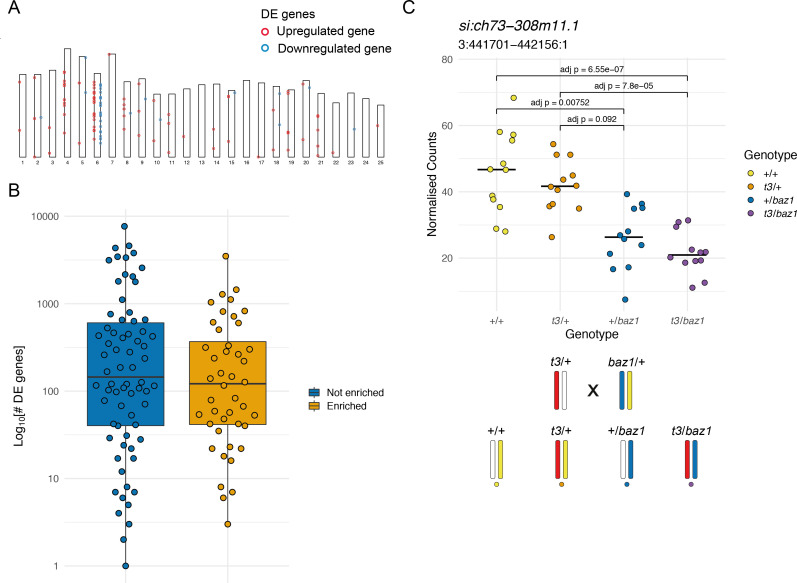
(A) Ideogram showing the locations of the DE genes in a mitfaw2 incross. Circles represent DE genes and are coloured red if the gene is upregulated in the mutant embryos and blue if it is downregulated. (B) Distribution of the total number of DE genes in experiments according to whether there is an enrichment on the mutant chromosome (orange) or not (blue), plotted on a log10 scale. (C) Plot of normalised counts according to genotype in an intercross of two different sox10 alleles. Yellow = wild type (+/+), orange = sox10 t3 heterozygotes (t3/+), blue = sox10 baz1 heterozygotes (+/baz1), purple = sox10 t3, baz1 compound heterozygotes (t3/baz1). The schematic below the plot shows the chromosomes contributing to each genotype. Embryos that share the wild-type allele inherited from the baz1/+ parent (yellow chromosome) show higher expression levels.
Enrichment of differentially expressed (DE) genes on the mutant chromosome.