
- Title
-
Regenerating zebrafish scales express a subset of evolutionary conserved genes involved in human skeletal disease
- Authors
- Bergen, D.J.M., Tong, Q., Shukla, A., Newham, E., Zethof, J., Lundberg, M., Ryan, R., Youlten, S.E., Frysz, M., Croucher, P.I., Flik, G., Richardson, R.J., Kemp, J.P., Hammond, C.L., Metz, J.R.
- Source
- Full text @ BMC Biol.
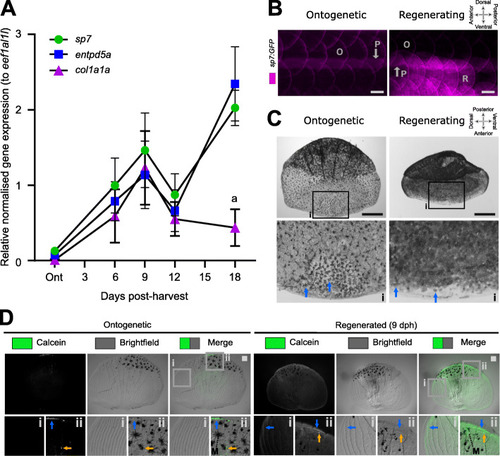
Regenerating scales express metabolic active bone growth markers at 9 days post-harvest. A Quantitative real-time PCR of osteoblast (sp7), mineralisation (entpd5a), and matrix growth (col1a1a) amplicon expression (n = 4 fish). Two-way ANOVA analysis showed that there was no interaction factor variance (p = 0.133) but that time (f(4) = 9.47, p< 0.001) and amplicon (f(2) = 4.62, p< 0.05) had independent statistically significant effects. Tukey’s multiple comparison determined that col1a1a was significantly lower expressed at 18 days post-harvest (dph) compared to other amplicons (a). B In toto fluorescent stereomicroscope images of flanks from sp7:GFP transgenic fish showing ontogenetic (O) and 9 dph regenerated scales (R) in an anterior (left) to posterior (right) direction). Note the auto-fluorescent pigment stripe (P) and the compass orientation is used to depict in toto scales in this paper with the distal (posterior) edge pointing caudally. C In situ alkaline phosphatase staining of a pre-collection and 9 dph scale with insets (i) showing anterior part of the scale. Blue arrows indicate ALP+ cells which appear to be larger and more extended in ontogenetic than regenerating scales. Compass orientation is used to depict in situ scales in this paper as the anterior region was closest to the scale dermal socket (pre-harvest). D Representative stereomicroscope images of live calcein green staining labelling newly deposited calcium phosphate in ontogenetic and regenerating scales (n = 4 fish each condition). Blue arrow indicates elevated levels of calcein green labelling compared to surrounding signal whereas orange arrows indicate small puncta of enhanced signal. Insets show lateral circuli (i) and posterior epidermal (containing pigmentating melanocytes (M) region (ii). Scale bar: 100 μm |
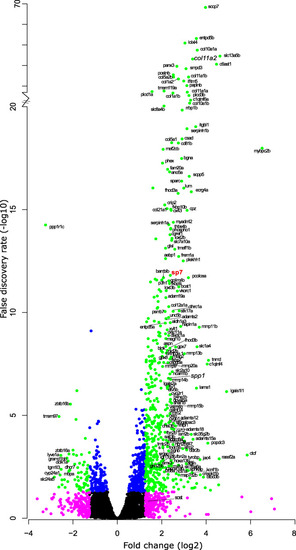
Volcano plot of RNA-seq data comparing expression between ontogenetic and 9 days post-harvest regenerating scales. Relative fold change (log2) and false discovery rate (-log10 converted) of coding RNA sequences that were expressed in both ontogenetic and regenerating scales. Green (≥±1.25 fold change, ≥ 1.3 FDR), magenta (≥±1.25 fold change, < 1.3 FDR), blue (<±1.25 fold change, ≥1.3 FDR), and black (not passing any threshold) coloured dots mark the different criteria |
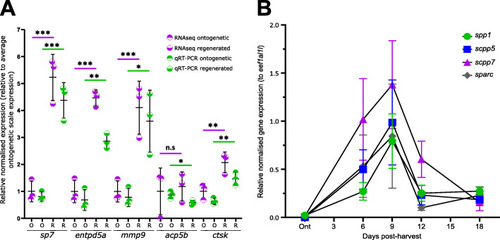
Validation of RNA-sequencing dataset and SCPP repertoire gene expression during scale regeneration. A Comparison of relative expression levels of qRT-PCR (unpaired t test) and transcriptomic analysis (false discovery rate) of selected amplicons. Total RNA used for RNA-seq experiment was used. B Quantitative real-time PCR (qRT-PCR) of secretory calcium-binding protein (SCPP) family genes that were differentially expressed in the RNA-seq dataset (n = 4 fish). Two-way ANOVA analysis showed that there was no interaction factor variance (p = 0.882) but that time (f(4) = 11.05, p=0.001) was the only independent statistically significant effect on amplicon expression |
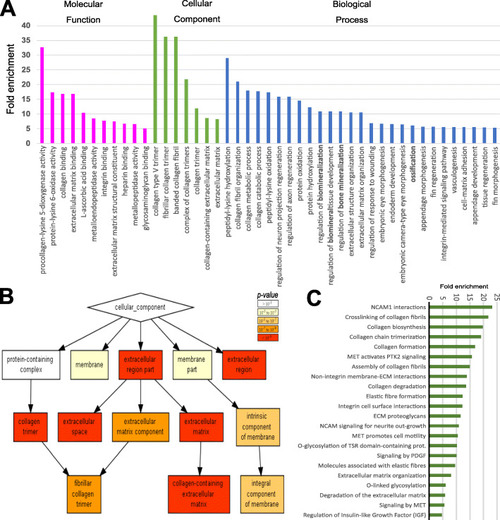
Gene ontology and pathway analysis. A Panther gene ontology (GO) analysis showing high enrichment (> 5 fold) of collagen, ossification, and ECM related terms. B GOrilla software showing cellular component hierarchical clustering of collagen-related GO terms. C) Graphical representation of enrichment (> 5 fold) of differentially expressed gene set using Panther Reactome Pathway overrepresentation test (v65) that showed enrichment of cell adhesion, collagen matrix and processing and glycosylation terms |
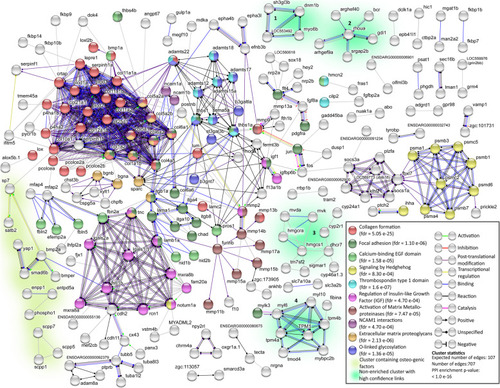
STRING network analysis of DEGs. Only DEG proteins with 1 or more protein-protein interactions (PPI) (indicated as edges) were shown |
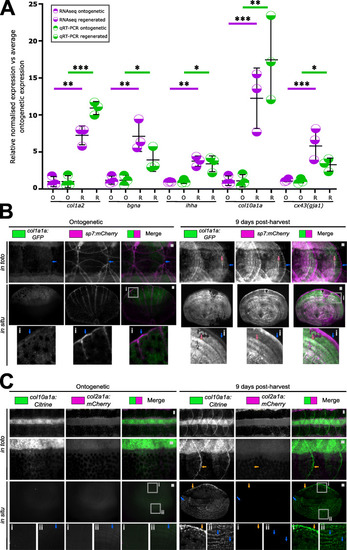
Expression validation of gene ontology findings. A Relative expression levels of qRT-PCR (unpaired t test) and transcriptomic analysis of amplicons (false discovery rate) found in the collagen, proteoglycan and hedgehog signalling networks. B Images of in toto and harvested scales (in situ) of col1a1a:GFP and sp7:mCherry-NTR double transgenic fish (n = 4 each condition). Blue arrow indicates the posterior (distal) fringe with high expression of mCherry. Orange arrow points at co-expression of GFP and mCherry. C In toto and in situ stereomicroscope images of col10a1a:Citrine and col2a1a:mCherry double transgenic ontogenetic and regenerating scales (n = 4 fish each condition). Orange arrows indicate Citrine signal at the posterior distal edge (inset i) while blue arrow points at a newly forming lateral circulus (inset ii) of the scale. Scale bar: 100 μm |
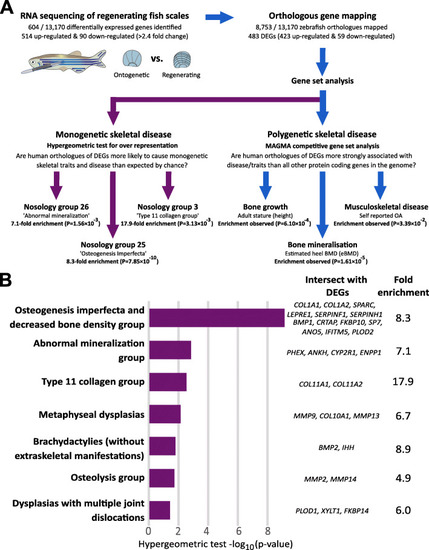
Genes that are upregulated during zebrafish scale regeneration are enriched for genes involved in human musculoskeletal disease. A Schematic describing the experimental design used to show that zebrafish DEGs are enriched for genes that cause rare monogenetic skeletal disorders in humans, and for genes that are robustly associated with polygenetic human traits: bone mineral density and height. B Bar plot summarising results of enrichment analysis involving genes that that cause different monogenetic dysplasia subgroups. The size of each bar reflects the strength of evidence of enrichment [i.e. hypergeometric-log10 (p-value). Only dysplasia subgroups with nominal evidence of enrichment (p-value < 0.05) are shown. Human gene symbols corresponding to upregulated genes that have human orthologues that cause different monogenetic dysplasia subgroups in humans are listed |
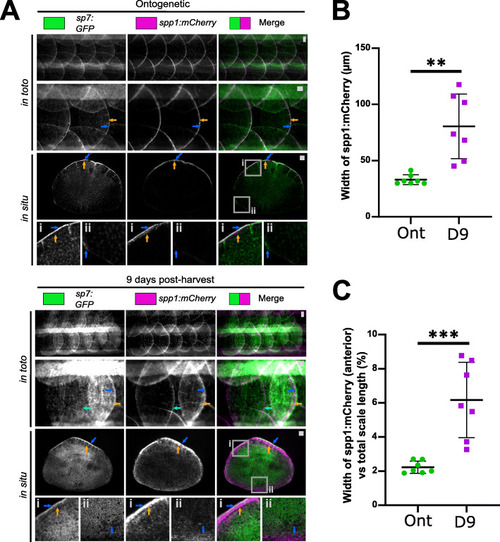
Validation of genes associated with polygenic traits in humans. A Images of scales from in toto and harvested scales of sp7:GFP and spp1:mCherry double transgenic fish (ontogenetic: n = 5, regenerating: n = 4 fish). For overview and inset i, blue arrows indicate high GFP signal and orange the mCherry signal at the posterior edge (inset i) while light blue arrow indicates an ontogenetic scale next to a regenerating scale. Inset ii shows anterior region of the scale with opposite GFP and mCherry signals (blue arrow) in ontogenetic and regenerating conditions. B Quantification of width of the mCherry signal at the posterior edge from harvested scales (between blue and orange arrows in panel C). C Width of mCherry signal normalised by scale length (anterior to posterior). Unpaired two-tailed student t-test p -values are shown on the graph. Scale bar: 100 μm |
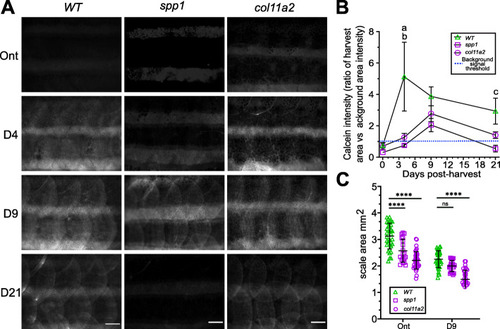
Phenotyping of ontogenetic and regenerating spp1P160X and col11a2Y228X homozygous mutant scales. A In toto images of calcein stained fish showed a delay in scale calcification of predominantly spp1 mutant fish. B A two-way ANOVA analysis on intensity measurements of in toto calcein stained fish showed that there was no interaction between genotype and time on calcein uptake (p=0.22), but that genotype (f(2) = 8.64, p< 0.01) and time (f(3) = 4.78, p< 0.001) independently had a significant effect. Tukey’s multiple comparison showed that spp1 (a) and col11a2 (b) mutants had significantly reduced calcein at 4 dph (p< 0.01). spp1 mutants had a reduced tendency at 21 dph (c, p=0.09). C Scale size was significantly reduced in both mutants (two-way ANOVA, there was no interaction between genotype and time on scale area (p=0.10), but that genotype (f(1) = 22.49, p< 0.0001) and time (f(2) = 12.52, p< 0.0001) independently had a significant effect). Metrics were derived from Von Kossa stained scales (Additional file 2: Fig. S8). Tukey’s multiple comparison p-values are shown on the graph. Scale bar: 100 μm |
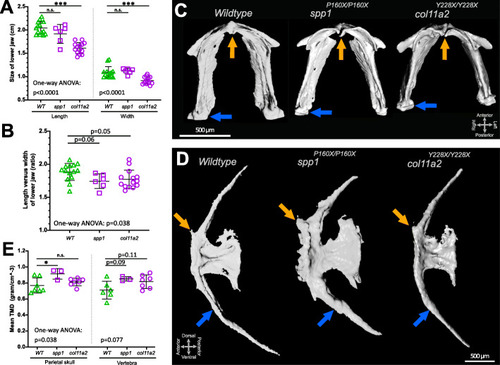
Histomorphology and tissue mineral density measurements on 3D micro-CT images of spp1P160X and col11a2Y228X homozygous mutants revealed altered bone structures. A Lower jaw size was reduced in col11a2 mutants (one-way ANOVA: length: (f(2) = 33.38, p< 0.0001), width: (f(2) = 15.06, p< 0.0001)). B A one-way ANOVA (f(2) = 3.636, p< 0.05) analysis indicated that lower jaw element proportions showed an altered tendency in both mutants. C Ventral view of the segmented lower jaw images. Orange arrow indicates anterior mandibular arch joint and blue arrow shows mandibular arch—palatoquadrate (not visible) joint. D Lateral view of segmented images of the first caudal vertebra showing the anterior facet (orange arrow) and haemal arch (blue arrow). E Mean tissue mineral density (TMD) calculations and one-way ANOVA analysis of dermal parietal skull (f(2) = 4.144, p< 0.05) and notochord sheath derived vertebral (p=0.077) bone. Tukey’s multiple comparison p-values are shown on the graphs |