
|
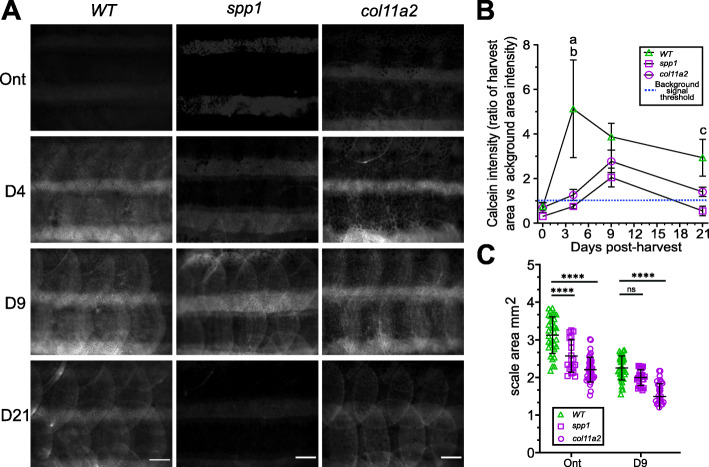
Fig. 9
Phenotyping of ontogenetic and regenerating spp1P160X and col11a2Y228X homozygous mutant scales. A In toto images of calcein stained fish showed a delay in scale calcification of predominantly spp1 mutant fish. B A two-way ANOVA analysis on intensity measurements of in toto calcein stained fish showed that there was no interaction between genotype and time on calcein uptake (p=0.22), but that genotype (f(2) = 8.64, p< 0.01) and time (f(3) = 4.78, p< 0.001) independently had a significant effect. Tukey’s multiple comparison showed that spp1 (a) and col11a2 (b) mutants had significantly reduced calcein at 4 dph (p< 0.01). spp1 mutants had a reduced tendency at 21 dph (c, p=0.09). C Scale size was significantly reduced in both mutants (two-way ANOVA, there was no interaction between genotype and time on scale area (p=0.10), but that genotype (f(1) = 22.49, p< 0.0001) and time (f(2) = 12.52, p< 0.0001) independently had a significant effect). Metrics were derived from Von Kossa stained scales (Additional file 2: Fig. S8). Tukey’s multiple comparison p-values are shown on the graph. Scale bar: 100 μm