
|
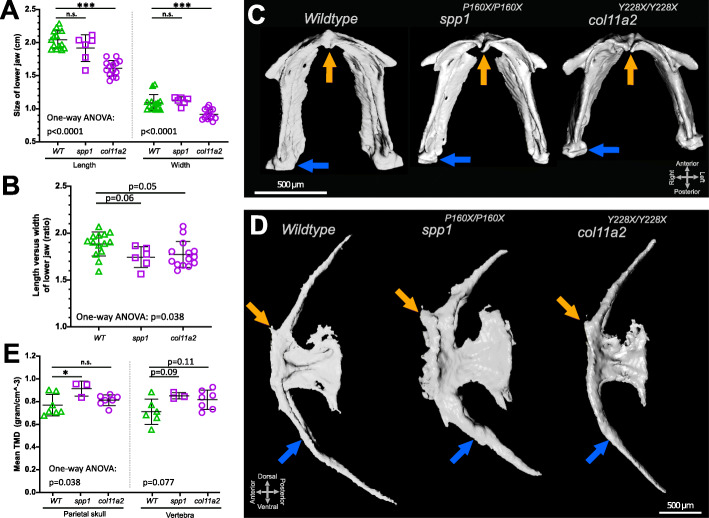
Fig. 10
Histomorphology and tissue mineral density measurements on 3D micro-CT images of spp1P160X and col11a2Y228X homozygous mutants revealed altered bone structures. A Lower jaw size was reduced in col11a2 mutants (one-way ANOVA: length: (f(2) = 33.38, p< 0.0001), width: (f(2) = 15.06, p< 0.0001)). B A one-way ANOVA (f(2) = 3.636, p< 0.05) analysis indicated that lower jaw element proportions showed an altered tendency in both mutants. C Ventral view of the segmented lower jaw images. Orange arrow indicates anterior mandibular arch joint and blue arrow shows mandibular arch—palatoquadrate (not visible) joint. D Lateral view of segmented images of the first caudal vertebra showing the anterior facet (orange arrow) and haemal arch (blue arrow). E Mean tissue mineral density (TMD) calculations and one-way ANOVA analysis of dermal parietal skull (f(2) = 4.144, p< 0.05) and notochord sheath derived vertebral (p=0.077) bone. Tukey’s multiple comparison p-values are shown on the graphs