
|
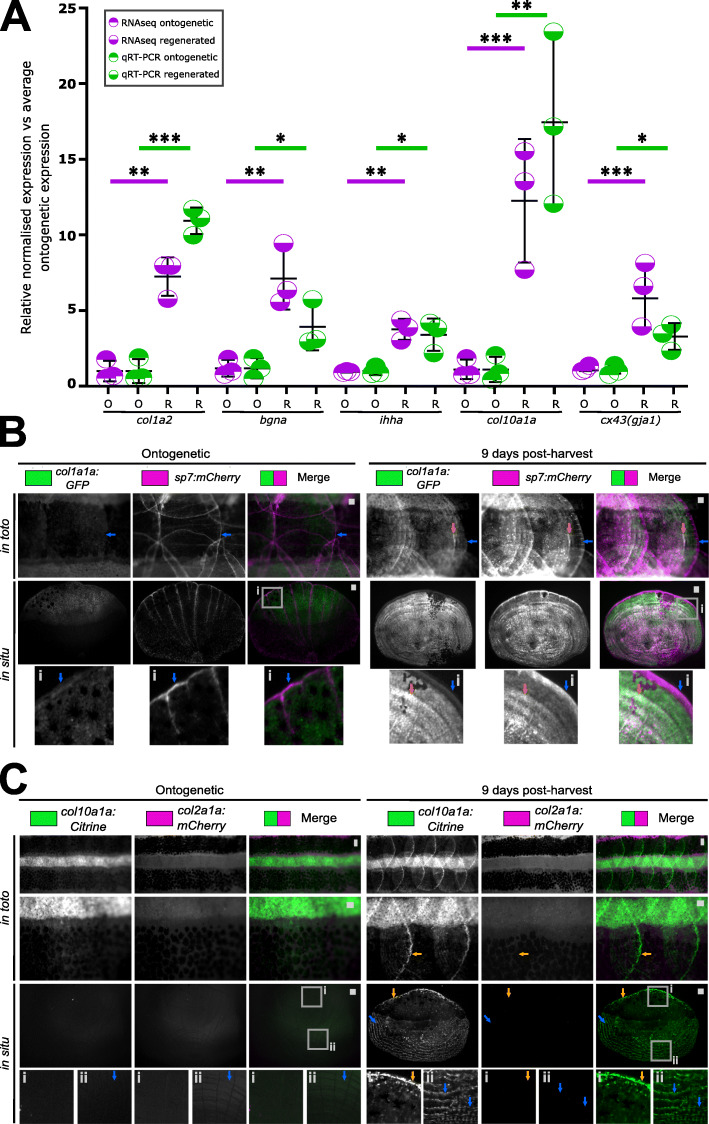
Fig. 6
Expression validation of gene ontology findings. A Relative expression levels of qRT-PCR (unpaired t test) and transcriptomic analysis of amplicons (false discovery rate) found in the collagen, proteoglycan and hedgehog signalling networks. B Images of in toto and harvested scales (in situ) of col1a1a:GFP and sp7:mCherry-NTR double transgenic fish (n = 4 each condition). Blue arrow indicates the posterior (distal) fringe with high expression of mCherry. Orange arrow points at co-expression of GFP and mCherry. C In toto and in situ stereomicroscope images of col10a1a:Citrine and col2a1a:mCherry double transgenic ontogenetic and regenerating scales (n = 4 fish each condition). Orange arrows indicate Citrine signal at the posterior distal edge (inset i) while blue arrow points at a newly forming lateral circulus (inset ii) of the scale. Scale bar: 100 μm