
- Title
-
An Orthotopic Model of Uveal Melanoma in Zebrafish Embryo: A Novel Platform for Drug Evaluation
- Authors
- Tobia, C., Coltrini, D., Ronca, R., Loda, A., Guerra, J., Scalvini, E., Semeraro, F., Rezzola, S.
- Source
- Full text @ Biomedicines
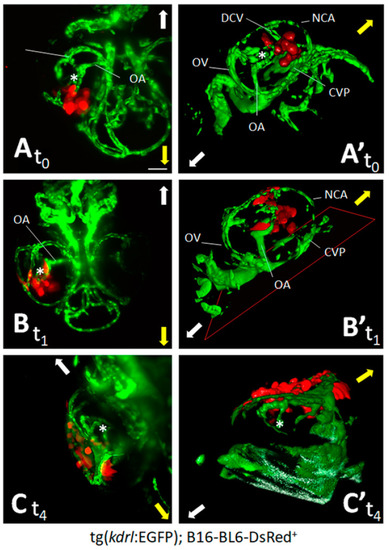
Zebrafish embryo eye is a microenvironment suitable for cell grafting. Murine melanoma B16-BL6-DsRed+ cells (100 cells/embryo) were orthotopically injected in the posterior side of the developing eye of transgenic tg(kdrl:EGFP) zebrafish embryos at 48 hpf. Maximum intensity projection of the z-stacks (A–C) and 3D reconstructions (A’–C’) of B16-BL6-DsRed+ cells performed at 1 h (t0) (A,A’), 1 day (t1) (B,B’), and 4 days (t4) (C,C’) post implantation. (A,B) ventral view; (C) dorsal view. Asterisk indicates the hyaloid artery. Arrows indicate embryo orientation: white arrow, posterior side; yellow arrow, anterior side. CVP, choroidal vascular plexus; DCV, dorsal ciliary vein; NCA, nasal ciliary artery; OA, optic artery; OV, optic vein. Scale bar: 50 µm. |
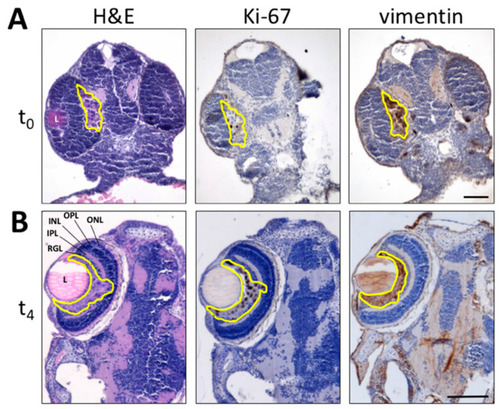
Histological analysis of melanoma B16-BL6-DsRed+ xenografts. Paraffin sections of B16-BL6-DsRed+ cells grafted into zebrafish embryo eyes obtained at 1 h (t0) (A) or 4 days (t4) post implantation (B) are stained by H&E (left panel) whereas Ki-67 (central panel) and vimentin (right panel) immunoreactivity is shown in brown. Tumor area is highlighted in yellow. L, lens; INL, inner nuclear layer; IPL, inner plexiform layer; ONL, outer nuclear layer; OPL, outer plexiform layer; RGL, retinal ganglion cell layer. Scale bars: 50 µm. |
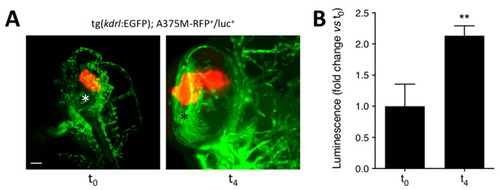
Luciferase-based quantification of the growth of human melanoma A375M-RFP+/luc+ xenografts. Human melanoma A375M-RFP+/luc+ cells (100 cells/embryo) were injected into the posterior side of the developing eye of transgenic tg(kdrl:EGFP) zebrafish embryos at 48 hpf. (A) Maximum intensity projection of the z-stacks of A375M-RFP+/luc+ cells performed at 1 h (t0) and 4 days (t4) post implantation. T0, lateral view, anterior to the top; t4, dorsal view, anterior to the top. Asterisk indicates the superficial ocular vasculature. Scale bar: 50 µm. (B) Evaluation of A375M-RFP+/luc+ bioluminescence signal in the lysates of the whole embryos at t0 and t4. Data are the mean ± SEM (n = 8). ** p < 0.01 vs. t0, Student’s t-test. |
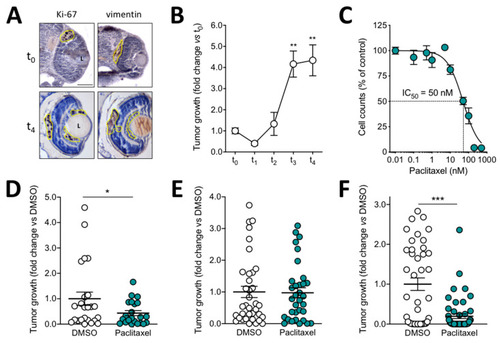
Effect of paclitaxel on the growth of murine melanoma B16-LS9-luc+ xenografts. (A) Immunohistochemical analysis of zebrafish embryo eyes at 1 h (t0) and 4 days (t4) after orthotopic injection of B16-LS9-luc+ cells. Ki-67 (left panel) and vimentin (right panel) are detected in brown. Tumor area is highlighted in yellow. L, lens. Scale bar: 50 µm. (B) B16-LS9-luc+ bioluminescence signal was evaluated 1 h (t0), 1 day (t1), 2 days (t2), 3 days (t3), and 4 days (t4) post implantation in the lysates of the whole embryos. Data are the mean ± SEM of five independent experiments. ** p < 0.01 vs. t0 and t1, ANOVA. (C) Effect of paclitaxel on the proliferation of B16-LS9-luc+ cells in vitro. Viable cells were counted after 72 h of incubation with increasing concentrations of the drug. Data are the mean ± SEM of three independent experiments. (D) B16-LS9-luc+ cells were cultured for 24 h in vitro in the absence or in the presence of 0.5 µM paclitaxel or with the corresponding volume of DMSO and then grafted in the zebrafish eye. Tumor growth was evaluated at t4 by measuring the cell luminescence signal in the lysates of the whole embryos. Data are the mean ± SEM (n = 20). * p < 0.05 vs. DMSO, Student’s t-test. (E) After injection of B16-LS9-luc+ cells into the zebrafish eye, embryos were incubated at t0 with 10 µM paclitaxel or with the corresponding volume of DMSO, both dissolved in fish water. Tumor growth was evaluated at t4 by measuring the cell luminescence signal. Data are the mean ± SEM (n = 35). (F) After B16-LS9-luc+ cell grafting into the zebrafish eye, 0.4 pmoles/embryo of paclitaxel or of the corresponding volume of DMSO were injected in the same eye. Tumor growth was evaluated at t4 by measuring the cell luminescence signal. Data are the mean ± SEM (n = 45). In (D–F), each dot represents one embryo. *** p < 0.0001 vs. DMSO, Student’s t-test. |
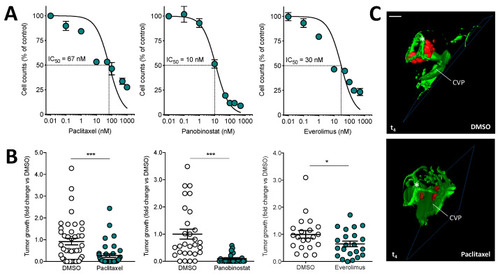
Effect of anticancer drugs on the growth of human uveal melanoma 92.1-RFP+/luc+ xenografts. (A) Effect of paclitaxel, panobinostat, and everolimus treatments on the proliferation of 92.1-RFP+/luc+ cells in vitro. Viable cells were counted after 48 h of incubation with increasing concentrations of paclitaxel or panobinostat or after 72 h of incubation with everolimus. Data are the mean ± SEM of two independent experiments. (B) After 92.1-RFP+/luc+ cell grafting into the zebrafish eye, 0.4 pmoles/embryo of paclitaxel, panobinostat, everolimus or the corresponding volume of DMSO were injected in the same eye. Tumor growth was evaluated at t4 by measuring the cell luminescence signal in the lysates of the whole embryos. Data are the mean ± SEM of two independent experiments. Each dot represents one embryo. * p < 0.05 and *** p < 0.001 vs. DMSO, Student’s t-test. (C) 3D reconstruction of the eye region of 92.1-RFP+/luc+ xenografts evaluated 4 days post implantation in the absence or in the presence of paclitaxel injection. Scale bar: 50 µm. Asterisk indicates the superficial ocular vasculature; CVP, choroidal vascular plexus. |