
IMAGE
Figure 2
- ID
- ZDB-IMAGE-220104-67
- Publication
- Tobia et al., 2021 - An Orthotopic Model of Uveal Melanoma in Zebrafish Embryo: A Novel Platform for Drug Evaluation
- All Figures
- Figures for Tobia et al., 2021
Image
|
Figure Caption
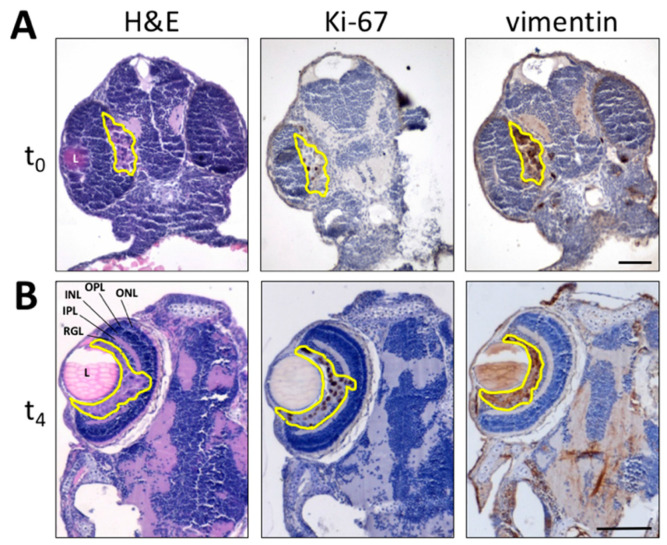
Figure 2
Histological analysis of melanoma B16-BL6-DsRed+ xenografts. Paraffin sections of B16-BL6-DsRed+ cells grafted into zebrafish embryo eyes obtained at 1 h (t0) (A) or 4 days (t4) post implantation (B) are stained by H&E (left panel) whereas Ki-67 (central panel) and vimentin (right panel) immunoreactivity is shown in brown. Tumor area is highlighted in yellow. L, lens; INL, inner nuclear layer; IPL, inner plexiform layer; ONL, outer nuclear layer; OPL, outer plexiform layer; RGL, retinal ganglion cell layer. Scale bars: 50 µm.
Acknowledgments
This image is the copyrighted work of the attributed author or publisher, and
ZFIN has permission only to display this image to its users.
Additional permissions should be obtained from the applicable author or publisher of the image.
Full text @ Biomedicines