
- Title
-
Analysis of the H-Ras mobility pattern in vivo shows cellular heterogeneity inside epidermal tissue
- Authors
- Gora, R.J., de Jong, B., van Hage, P., Rhiemus, M.A., van Steenis, F., van Noort, J., Schmidt, T., Schaaf, M.J.M.
- Source
- Full text @ Dis. Model. Mech.
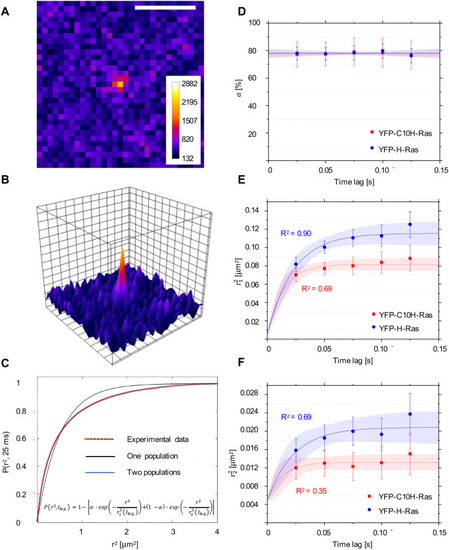
Single-molecule microscopy (SMM) analysis: protein localization and mobility patterns of YFP-C10H-Ras and YFP-H-Ras in HEK293T cells. (A) SMM intensity map showing signal of a YFP-C10H-Ras molecule located in the basal membrane of a HEK293T cell. Scale bar: 2 µm. (B) Three-dimensional representation of the image shown in A, depicting fluorescence intensities of each pixel. One visible intensity peak is shown that is attributed to a single YFP-C10H-Ras molecule. Over these peaks, two-dimensional Gaussian surfaces were fitted. (C) Representative cumulative distribution plot of squared displacements determined using particle image correlation spectroscopy (PICS) analysis. Data points are shown in red, and the two populations biexponential model that best fits the data points in blue (formula shown). Fitting of the data points to the two populations model allows for calculation of a relative size of the subpopulations (α) and their mean squared displacements (r12 and r22). This procedure was repeated for each of the time lags used. (D) Fraction size of the fast-diffusing population (α), plotted against the time lag. (E) Mean squared displacements plotted against the time lag for the fast-diffusing fraction (r21). (F) Mean squared displacements plotted against the time lag for the slow-diffusing fraction (r 22). Results of the fits are summarized in Table 1. To establish the values of dynamic parameters, at least three individual HEK293T cells per H-Ras construct (YFP-C10H-Ras and YFP-H-Ras) were imaged on each of the three different experimental days. Each data point is presented in the form of a mean±s.e.m., and the 95% confidence interval (c.i.) of the mathematical fit is shown. Shapiro–Wilk statistical test was performed to check for normality of the data set. Statistical analysis was performed using an unpaired Student's t-test with the resulting P-value P(α, r21, r22)>0.05 at a tlag of 25 ms. Pearson correlation coefficients (R2) are presented to show fitness of the data to the model of confined diffusion. |
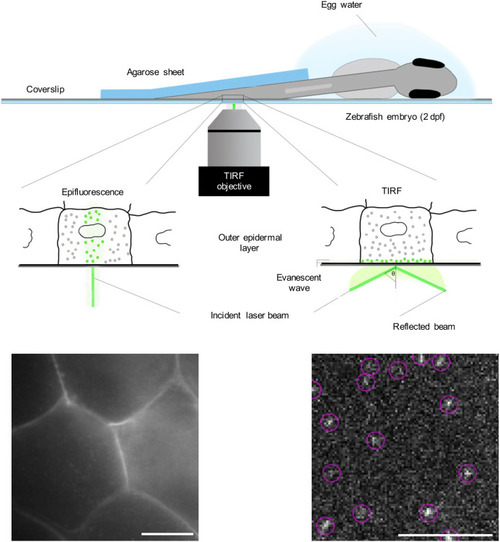
Schematic overview of SMM applied to a living zebrafish embryo. A zebrafish embryo was injected with an expression vector for a YFP fusion protein shortly after fertilization. At 2 dpf, it was placed on a coverslip coated with poly-L-lysine in a drop of egg water. The tail region of the embryo was covered with a 0.75-mm-thick agarose (2%) sheet. On the lower left part of the figure, an epifluorescence picture is presented of the outer layer of the epidermis, showing the fluorescent signal of YFP-C10H-Ras in the cell membranes. Morphologically, the cells in this layer are homogenous and are characterized by a hexagonal shape. On the lower right part, a TIRFM image of an area within the field of view of the epifluorescence picture is presented, with examples of individual YFP molecules shown in circles. Scale bars: 5 µm. |
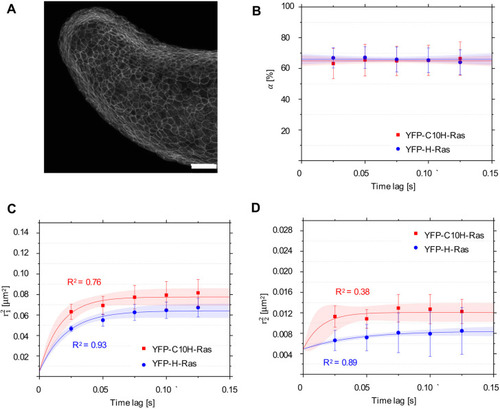
Mobility patterns of YFP-C10H-Ras and YFP-H-Ras in epidermal cells of the zebrafish embryos. (A) Confocal microscopy image of the outer epidermal cell layer of a 2 dpf zebrafish embryo from the transgenic line Tg(bactin:GFP-C10H-Ras)vu119, showing the fluorescence signal from GFP-C10H-Ras. Scale bar: 50 µm. (B) Fraction size of the fast-diffusing population (α), plotted against the time lag. (C) Mean squared displacements plotted against the time lag for the fast-diffusing fraction (r21). (D) Mean squared displacements plotted against the time lag for the slow-diffusing fraction (r22. Results of the fits are summarized in Table 1. To establish the values of dynamic parameters, three different embryos per each H-Ras construct (YFP-C10H-Ras and YFP-H-Ras) were imaged on each of the three (six for YFP-C10H-Ras) different experimental days. Each data point is presented in the form of mean±s.e.m., and the 95% c.i. of the mathematical fit is shown. Shapiro–Wilk statistical test was performed to check for normality of the data set. Statistical analysis was performed using an unpaired Student's t-test with a resulting P-value of P(α,r21, r22) )>0.05 at a tlag of 25 ms. Pearson correlation coefficients (R2) are presented to show fitness of the data to the model of confined diffusion. |

Mobility patterns of YFP-H-Ras and its mutants, YFP-H-RasV12 and YFP-H-RasN17, in epidermal cells of the zebrafish embryos. (A) Fraction size of the fast-diffusing population (α), plotted against the time lag. (B) Mean squared displacements plotted against the time lag for the fast-diffusing fraction (r21). (C) Mean squared displacements plotted against the time lag for the slow-diffusing fraction (r22). Results of the fits are summarized in Table 1. To establish the values of dynamic parameters, three different embryos per each H-Ras genetic mutant (YFP-H-Ras, YFP-H-RasV12 and YFP-H-RasN17) were imaged on each of the three different experimental days. Each data point is presented in the form of a mean±s.e.m., and the 95% c.i. of the mathematical fit is shown. Shapiro–Wilk statistical test was performed to check for normality of the data set. Statistical analysis was performed, using a one-way ANOVA [P(α)>0.05 and P(r21,r22)<0.05 at a tlag of 25 ms] with a Tukey's range post-hoc test (for details of the post-hoc test results, see Table 2). (D-F) Caterpillar plots presenting the effect range of a different experimental day, different embryos within an experimental day, and different areas within an embryo to an overall variability in the fast-diffusing fraction size (D), mean squared displacement of the fast-diffusing fraction (E) and mean squared displacement of the slow-diffusing fraction (F). Effect ranges represent the relative deviation of group intercepts from the overall mean with 95% c.i. Red lines indicate the overall mean of the data, while black points denote groups that significantly deviate from the overall mean among experimental days, individual embryos and areas within an embryo. The data points are sorted based on their deviation from the total average, beginning with the ones most negatively deviating from the overall mean. The values in D were logit transformed, and the values in E and F were logarithm transformed, to meet the statistical hypotheses of the hierarchical linear model. MSD, mean squared displacement. |
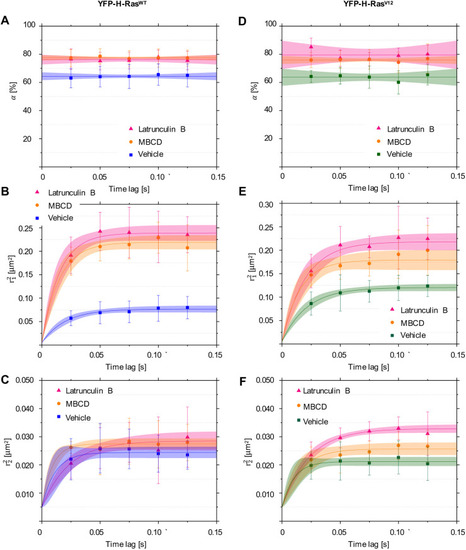
Mobility patterns of YFP-H-Ras and the constitutively active mutant YFP-H-RasV12, in epidermal cells of the zebrafish embryos after treatment with Latrunculin B (LatB) and methyl-β-cyclodextrin (MBCD). (A-C) Plots representing mobility patterns of the wild-type YFP-H-Ras. (A) Fraction size of the fast-diffusing population (α), plotted against the time lag. (B) Mean squared displacements plotted against the time lag for the fast-diffusing fraction ((r21). (C) Mean squared displacements plotted against the time lag for the slow-diffusing fraction (r21). (F) Mean squared displacements plotted against the time lag for the slow-diffusing fraction (r22). Parameters obtained upon curve fitting are presented in Table 1. To establish the values of dynamic parameters, three different embryos per each treatment group (vehicle, LatB and MBCD) and construct (YFP-H-RasV12, YFP-H-Ras) were imaged on each of the three different experimental days. Each data point is presented in the form of a mean±s.e.m., and the 95% c.i. of the mathematical fit is shown. Shapiro–Wilk statistical test was performed to check for normality of the data set. Statistical analysis was performed using a one-way ANOVA [for both H-RasWT and H-RasV12P(r22)>0.05 and P(α r21)<0.05 at a tlag of 25 ms] with a Tukey's range post-hoc test (for details of the post-hoc test results, see Table 2). |