
Fig. 3.
- ID
- ZDB-FIG-220305-54
- Publication
- Gora et al., 2021 - Analysis of the H-Ras mobility pattern in vivo shows cellular heterogeneity inside epidermal tissue
- Other Figures
- All Figure Page
- Back to All Figure Page
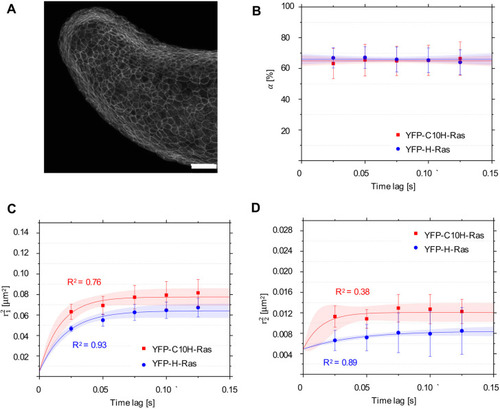
Mobility patterns of YFP-C10H-Ras and YFP-H-Ras in epidermal cells of the zebrafish embryos. (A) Confocal microscopy image of the outer epidermal cell layer of a 2 dpf zebrafish embryo from the transgenic line Tg(bactin:GFP-C10H-Ras)vu119, showing the fluorescence signal from GFP-C10H-Ras. Scale bar: 50 µm. (B) Fraction size of the fast-diffusing population (α), plotted against the time lag. (C) Mean squared displacements plotted against the time lag for the fast-diffusing fraction (r21). (D) Mean squared displacements plotted against the time lag for the slow-diffusing fraction (r22. Results of the fits are summarized in Table 1. To establish the values of dynamic parameters, three different embryos per each H-Ras construct (YFP-C10H-Ras and YFP-H-Ras) were imaged on each of the three (six for YFP-C10H-Ras) different experimental days. Each data point is presented in the form of mean±s.e.m., and the 95% c.i. of the mathematical fit is shown. Shapiro–Wilk statistical test was performed to check for normality of the data set. Statistical analysis was performed using an unpaired Student's t-test with a resulting P-value of P(α,r21, r22) )>0.05 at a tlag of 25 ms. Pearson correlation coefficients (R2) are presented to show fitness of the data to the model of confined diffusion. |