
Fig. 1.
- ID
- ZDB-FIG-220305-52
- Publication
- Gora et al., 2021 - Analysis of the H-Ras mobility pattern in vivo shows cellular heterogeneity inside epidermal tissue
- Other Figures
- All Figure Page
- Back to All Figure Page
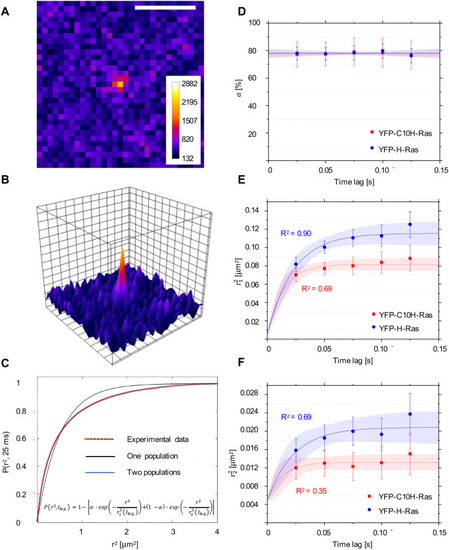
Single-molecule microscopy (SMM) analysis: protein localization and mobility patterns of YFP-C10H-Ras and YFP-H-Ras in HEK293T cells. (A) SMM intensity map showing signal of a YFP-C10H-Ras molecule located in the basal membrane of a HEK293T cell. Scale bar: 2 µm. (B) Three-dimensional representation of the image shown in A, depicting fluorescence intensities of each pixel. One visible intensity peak is shown that is attributed to a single YFP-C10H-Ras molecule. Over these peaks, two-dimensional Gaussian surfaces were fitted. (C) Representative cumulative distribution plot of squared displacements determined using particle image correlation spectroscopy (PICS) analysis. Data points are shown in red, and the two populations biexponential model that best fits the data points in blue (formula shown). Fitting of the data points to the two populations model allows for calculation of a relative size of the subpopulations (α) and their mean squared displacements (r12 and r22). This procedure was repeated for each of the time lags used. (D) Fraction size of the fast-diffusing population (α), plotted against the time lag. (E) Mean squared displacements plotted against the time lag for the fast-diffusing fraction (r21). (F) Mean squared displacements plotted against the time lag for the slow-diffusing fraction (r 22). Results of the fits are summarized in Table 1. To establish the values of dynamic parameters, at least three individual HEK293T cells per H-Ras construct (YFP-C10H-Ras and YFP-H-Ras) were imaged on each of the three different experimental days. Each data point is presented in the form of a mean±s.e.m., and the 95% confidence interval (c.i.) of the mathematical fit is shown. Shapiro–Wilk statistical test was performed to check for normality of the data set. Statistical analysis was performed using an unpaired Student's t-test with the resulting P-value P(α, r21, r22)>0.05 at a tlag of 25 ms. Pearson correlation coefficients (R2) are presented to show fitness of the data to the model of confined diffusion. |