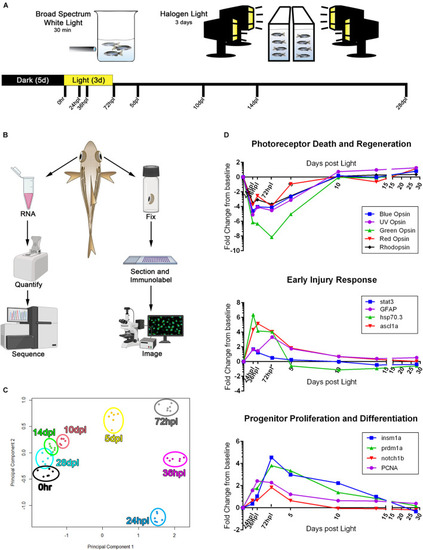
3′mRNA-seq analysis following phototoxic lesion and regeneration confirms gene expression trends known in the field. (A) Experimental design used for phototoxic lesion, with tissue collection time-points along the bottom designated in hours post-light (hpl) and days post-light (dpl). (B) Schematic demonstrating the workflow for tissue collection for each individual fish. (C) Principle component analysis constructed using the top 200 genes differentially regulated as compared to the 0 h baseline. All genes used in the analysis had an FDR < 7.5 × 10− 5. (D) RNA expression fold change from 0 h baseline for three processes of retinal regeneration well described in the literature, demonstrating validation of the 3′mRNA-seq method in determining gene expression changes during the retinal regeneration process. The genes highlighted represent three commonly reported stages in the regeneration process including the degeneration and regeneration of photoreceptors, early responding genes that turn on within 24 hpl, and progenitor cell response genes which peak around 72 hpl. Regeneration of lost photoreceptors is evidenced by the re-emergence of opsin gene expression starting at 5 dpl. For data presented in (C,D), n = 6 biological replicates. With the exception of the zebrafish rendering, all clipart in (B) was downloaded from BioRender.com.

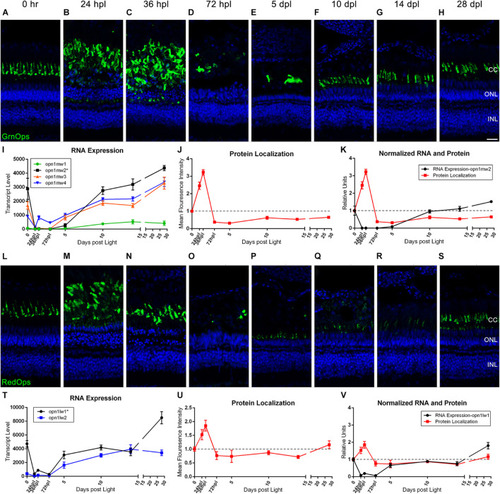
Green and red cone photoreceptor morphology paired with gene expression of isoforms throughout a 28 day lesion and regeneration time-course. (A–H) Green cone photoreceptor degeneration and regeneration is demonstrated in these retinal sections collected at baseline (0 h) through 28 days post phototoxic lesion (dpl), hours post light are denoted (hpl). Sections were immunolabeled with anti-Green Opsin and nuclei were stained blue with TO-PRO-3. Cone photoreceptors are mostly destroyed at 72 hpl after a period of initial hypertrophy (n = 5–6). (I) Graph of transcript pseudo-counts for all 4 paralogs of Green Opsin from 3′mRNA-seq of individual adult zebrafish retinas for each timepoint (n = 6). (J) ImageJ pixel intensity quantification for the Green Opsin signal in the confocal images normalized to 1 demonstrating relative intensity of protein localization within the retina at each timepoint. (K) Overlay of RNA expression for the most highly expressed Green Opsin, opn1mw2, normalized to 1 and ImageJ protein localization normalized to one. (L–S) Red cone photoreceptor degeneration and regeneration. Sections were immunolabeled with anti-Red Opsin and nuclei were stained blue with TO-PRO-3 (n = 5–6). (T) Graph of transcript pseudo-counts for both paralogs of Red Opsin from 3′mRNA-seq of individual adult zebrafish retinas for each timepoint (n = 6). (U) ImageJ pixel intensity quantification for the Red Opsin signal in the confocal images normalized to 1 demonstrating relative intensity of protein localization within the retina. (V) Overlay of RNA expression for the most highly expressed Red Opsin, opn1lw1, normalized to 1 and ImageJ protein localization normalized to one. Asterisks in paralog keys in (I,T) represent the most dominantly expressed paralog at the 0 h baseline that was also graphed in the merged normalized graphs (K) and (V). Scale bar represents 5 μm.

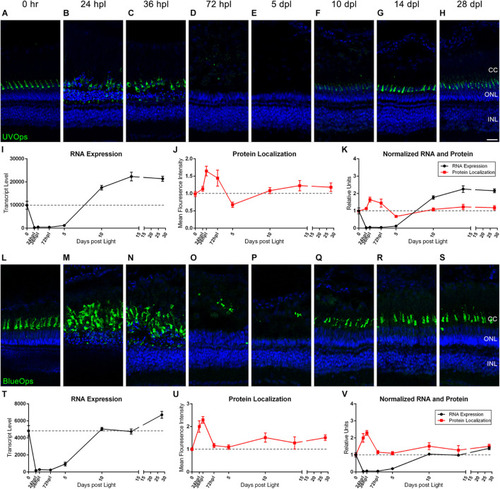
UV and Blue cone photoreceptor morphology paired with gene expression throughout a 28 day lesion and regeneration time-course. (A–H) UV cone photoreceptor degeneration and regeneration is demonstrated in these retinal sections collected at baseline (0 h) through 28 days post phototoxic lesion (dpl), hours post light are denoted (hpl). Sections were immunolabeled with anti-UV Opsin and nuclei were stained blue with TO-PRO-3. Cone photoreceptors are mostly destroyed at 72 hpl after a period of initial hypertrophy (n = 5–6). (I) Graph of transcript pseudo-counts for UV Opsin (opn1sw1) from 3′mRNA-seq of individual adult zebrafish retinas for each timepoint (n = 6). (J) ImageJ pixel intensity quantification for the UV Opsin signal in the confocal images normalized to 1, demonstrating relative intensity of protein localization within the retina. (K) Overlay of opn1sw1 RNA expression normalized to 1 and ImageJ protein localization normalized to one. (L–S) Blue cone photoreceptor degeneration and regeneration. Sections were immunolabeled with anti-Blue Opsin and nuclei were stained blue with TO-PRO-3 (n = 5–6). (T) Graph of transcript pseudo-counts for Blue Opsin (opn1sw2) from 3′mRNA-seq of individual adult zebrafish retinas for each timepoint (n = 6). (U) ImageJ pixel intensity quantification for the Blue Opsin signal in the confocal images normalized to 1, demonstrating relative intensity of protein localization within the retina. (V) Overlay of opn1sw2 RNA expression normalized to 1 and ImageJ protein localization normalized to one. Scale bar represents 5 μm.

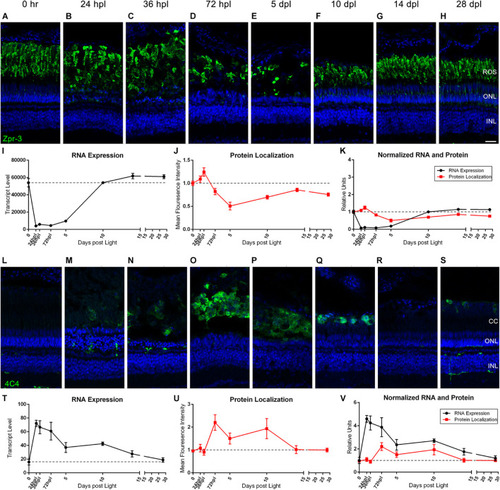
Rod photoreceptors degenerate in coordination with the infiltration of 4C4+ microglia/macrophages. (A–H) Rod photoreceptor degeneration and regeneration is demonstrated in these retinal sections collected at baseline (0 h) through 28 days post phototoxic lesion (dpl), hours post light are denoted (hpl). Sections were immunolabeled with Zpr-3, which stains rod photoreceptors and nuclei were stained blue with TO-PRO-3. Rod photoreceptors are notably slower to degenerate than the cone photoreceptors with lowest visual signal by 5 dpl (n = 5–6). (I) Graph of transcript pseudo-counts for rhodopsin (rho) from 3′mRNA-seq of individual adult zebrafish retinas for each timepoint (n = 6). (J) ImageJ pixel intensity quantification for the Zpr-3 signal in the confocal images normalized to 1, demonstrating relative intensity of protein localization within the retina. (K) Overlay of rho RNA expression normalized to 1 and ImageJ protein localization normalized to one. (L–S) Infiltration of microglia/macrophage inflammatory cells into the retina demonstrating a peak infiltration at 72 hpl, corresponding with the drop in protein signal from rod photoreceptors at the same timepoints. Sections were immunolabeled with anti-4C4 which labels microglia/macrophages and nuclei were stained blue with TO-PRO-3 (n = 5–6). (T) Graph of transcript pseudo-counts for mpeg1.1, a gene expressed by macrophages, from 3′mRNA-seq of individual adult zebrafish retinas for each timepoint (n = 6). (U) ImageJ pixel intensity quantification for the 4C4 signal in the confocal images normalized to 1, demonstrating relative intensity of protein localization within the retina. (V) Overlay of mpeg1.1 RNA expression normalized to 1 and ImageJ protein localization normalized to one. Scale bar represents 5 μm.

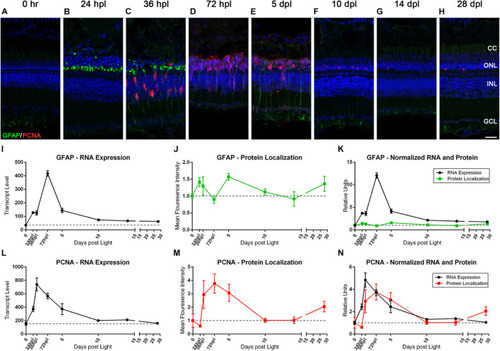
The Müller glia response to phototoxic lesion paired with gene expression signatures. (A–H) The Müller glia (MG) response to phototoxic lesion is demonstrated in these retinal sections collected at baseline (0 h) through 28 days post phototoxic lesion (dpl), hours post light are denoted (hpl) by immunolabeling the intermediate filaments of MG with anti-GFAP (green) and their entry into the cell cycle with PCNA (red). Nuclei were stained blue with TO-PRO-3. Gliosis is highlighted in a biphasic manner: in the ONL MG end-feet at 24 hpl, and then spanning the length of MG at 5 dpl. The PCNA localization demonstrates single MG nuclei entering the cell cycle at 36 hpl with peak proliferation of MGPCs at 72 hpl (n = 5–6). (I) Graph of transcript pseudo-counts for GFAP from 3′mRNA-seq of individual adult zebrafish retinas for each timepoint (n = 6). (J) ImageJ pixel intensity quantification for the GFAP signal in the confocal images normalized to 1, demonstrating relative intensity of protein localization within the retina. (K) Overlay of GFAP RNA expression normalized to 1 and ImageJ protein localization normalized to one. The discordance in the gene expression and protein localization suggests that the first GFAP protein intensity peak at 24 hpl is due to a redistribution of existing GFAP protein and the second protein intensity peak at 5 dpl is due to increased transcription of GFAP. (L) Graph of transcript pseudo-counts for PCNA from 3′mRNA-seq of individual adult zebrafish retinas for each timepoint (n = 6). (M) ImageJ pixel intensity quantification for the PCNA signal in the confocal images normalized to 1, demonstrating relative intensity of protein localization within the retina. (N) Overlay of PCNA RNA expression normalized to 1 and ImageJ protein localization normalized to one. Scale bar represents 5 μm.

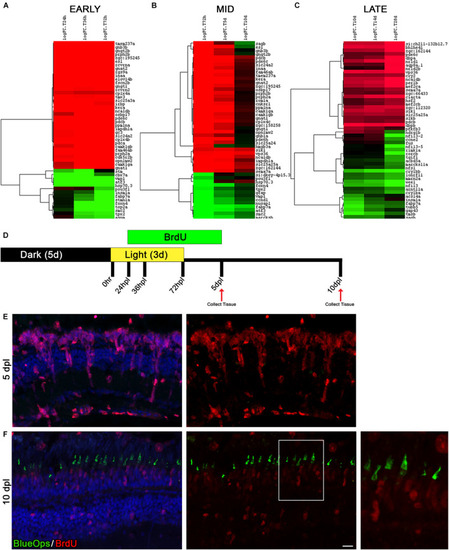
The time window between days 5 and 10 of regeneration represents a distinct turning point toward differentiation. (A–C) A time-course analysis was performed on each of the following three time periods; early response (24, 36, and 72 hpl), mid-regeneration (72 hpl, 5, and 10 dpl), and late-regeneration (10, 14, and 28 dpl). The top 50 genes were run through hierarchical clustering with complete linkage in Gene Cluster 3.0. Genes upregulated from the 0 h baseline are in green and downregulated from the 0 h baseline are in red. All top 50 genes had an FDR < 2 × 10− 9. (D) To trace newly generated cells during the process of regeneration, cells were labeled with BrdU added to the fish water from 24 hpl (prior to MG cell cycle entry) to 5 dpl (past the peak proliferation timepoint) and harvested at 5 and 10 dpl. (E,F) Retinal sections were co-labeled with anti-BrdU (red) and anti-Blue Opsin (green) at 5 dpl (E) and 10 dpl (F). Nuclei were stained blue with TO-PRO-3. We did not observe immunolocalization of Blue Opsin at 5 dpl (E). In contrast, the expansion in the bottom right highlights that the Blue Opsin signal seen in the new outer segments of cones at 10 dpL is coming from the BrdU-positive, newly derived cone photoreceptors as a result of regeneration. The heat map paired with the immunolabeling comparison of the 5–10 dpl timepoints demonstrates that the period of time between 5 and 10 dpl likely represents a major cell fate decision point in which stem cell pathways are being shut down and pro-differentiation pathways are being turned on. Scale bar represents 5 μm.

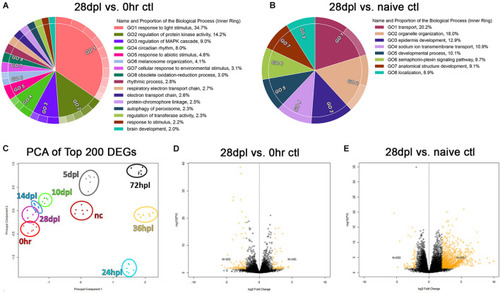
28 days post light does not represent transcriptional recovery to either the 0 h, or naïve control transcriptional baseline. (A) Gene Ontology (GO) was performed on the time-course analyses of all significantly differentially regulated genes (DEGs) (p < 0.002) comparing dark-adapted 0 h controls to 28 dpL retinas and (B) non-dark-adapted naïve controls to 28 dpL retinas. Significant DEGs were run through the “Reduce and Visualize Gene Ontology” (REVIGO) software to remove redundant GO terms based on similarity. Circular Visualization plots were generated using the Circular Gene Ontology terms Visualization (CirGO) algorithm displaying up to 20 of the most represented categories. Inner rings represent the hierarchical summary categories identified by the REVIGO software that contain the subcategories in the outer rings that fall under the umbrella term (not shown). Keys to the right of each graph represent labels for the inner ring categories. (C) Principle component analysis constructed using the top 200 genes differentially regulated as compared to the 0 h baseline, with the addition of the non-dark-adapted naïve control group (“nc” dark red) which clustered distinct from both the dark-adapted 0 h controls and the 28 dpL retinas. (D,E) Volcano plots highlighting the remaining significant DEGs in yellow (p < 0.05) at (D) 28 dpL compared to dark-adapted 0 h controls and (E) 28 dpL compared to naïve controls.

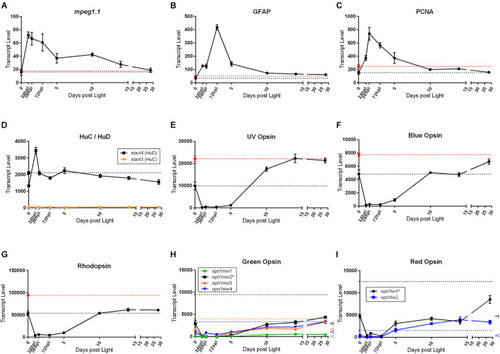
Common genes studied in retinal regeneration with dark adapted 0 h control, and naïve, non-dark adapted control baselines. All graphs in this figure represent transcript pseudo-counts for each of the genes listed above the plots from 3′mRNA-seq of individual adult zebrafish retinas for each timepoint (n = 6). In plots (A–G), the black dotted line on the y-axis represents the baseline gene expression for the dark-adapted 0 h controls, the red dotted line represents the gene expression baseline of age-matched, non-dark-adapted naïve control retinas. In plots (H,I), colored dotted lines on the y-axis correspond to the naïve control baseline gene expression corresponding to the same color of the genes in the key. The dark-adapted control baselines are not highlighted in these plots for ease of interpretation. Instead, on the far-right axis, empty arrowheads corresponding to the 0 h control baseline transcript values are displayed for reference. For inflammatory (A), gliotic (B), proliferative (C), and inner nuclear layer (D) markers, we observe that the dark-adapted 0 h controls and the naïve controls have similar baseline expression and the expression pattern generally resolves to baseline at 28 dpl. The opsins have several distinct patterns of recovery. (E,F) Short wavelength cone opsins recover to the naïve control gene expression baseline whereas (G) Rod photoreceptor opsin expression returns to the dark-adapted 0 h control baseline. (H,I) Medium and long wavelength opsins appear to have different patterns of recovery even between paralogs of the same opsin, with some paralogs returning to the naïve control baseline and some returning to the dark-adapted 0 h control baseline. Asterisks in paralog keys in (H,I) represent the most dominantly expressed paralog at the 0 h baseline for opsins with multiple paralogs.

Acknowledgments
This image is the copyrighted work of the attributed author or publisher, and ZFIN has permission only to display this image to its users. Additional permissions should be obtained from the applicable author or publisher of the image. Full text @ Front Cell Dev Biol