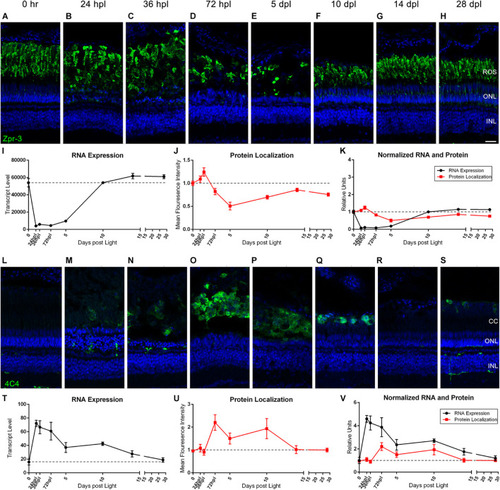
Rod photoreceptors degenerate in coordination with the infiltration of 4C4+ microglia/macrophages. (A–H) Rod photoreceptor degeneration and regeneration is demonstrated in these retinal sections collected at baseline (0 h) through 28 days post phototoxic lesion (dpl), hours post light are denoted (hpl). Sections were immunolabeled with Zpr-3, which stains rod photoreceptors and nuclei were stained blue with TO-PRO-3. Rod photoreceptors are notably slower to degenerate than the cone photoreceptors with lowest visual signal by 5 dpl (n = 5–6). (I) Graph of transcript pseudo-counts for rhodopsin (rho) from 3′mRNA-seq of individual adult zebrafish retinas for each timepoint (n = 6). (J) ImageJ pixel intensity quantification for the Zpr-3 signal in the confocal images normalized to 1, demonstrating relative intensity of protein localization within the retina. (K) Overlay of rho RNA expression normalized to 1 and ImageJ protein localization normalized to one. (L–S) Infiltration of microglia/macrophage inflammatory cells into the retina demonstrating a peak infiltration at 72 hpl, corresponding with the drop in protein signal from rod photoreceptors at the same timepoints. Sections were immunolabeled with anti-4C4 which labels microglia/macrophages and nuclei were stained blue with TO-PRO-3 (n = 5–6). (T) Graph of transcript pseudo-counts for mpeg1.1, a gene expressed by macrophages, from 3′mRNA-seq of individual adult zebrafish retinas for each timepoint (n = 6). (U) ImageJ pixel intensity quantification for the 4C4 signal in the confocal images normalized to 1, demonstrating relative intensity of protein localization within the retina. (V) Overlay of mpeg1.1 RNA expression normalized to 1 and ImageJ protein localization normalized to one. Scale bar represents 5 μm.
|
