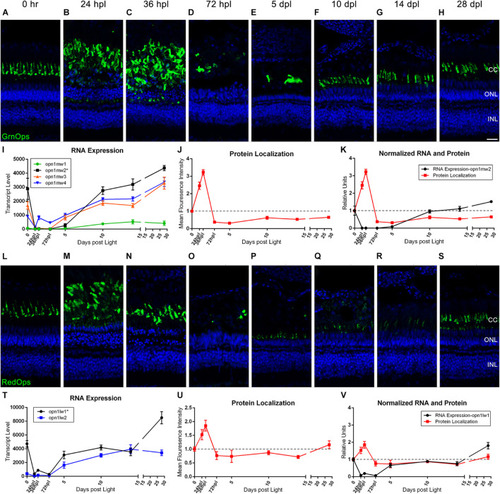
Green and red cone photoreceptor morphology paired with gene expression of isoforms throughout a 28 day lesion and regeneration time-course. (A–H) Green cone photoreceptor degeneration and regeneration is demonstrated in these retinal sections collected at baseline (0 h) through 28 days post phototoxic lesion (dpl), hours post light are denoted (hpl). Sections were immunolabeled with anti-Green Opsin and nuclei were stained blue with TO-PRO-3. Cone photoreceptors are mostly destroyed at 72 hpl after a period of initial hypertrophy (n = 5–6). (I) Graph of transcript pseudo-counts for all 4 paralogs of Green Opsin from 3′mRNA-seq of individual adult zebrafish retinas for each timepoint (n = 6). (J) ImageJ pixel intensity quantification for the Green Opsin signal in the confocal images normalized to 1 demonstrating relative intensity of protein localization within the retina at each timepoint. (K) Overlay of RNA expression for the most highly expressed Green Opsin, opn1mw2, normalized to 1 and ImageJ protein localization normalized to one. (L–S) Red cone photoreceptor degeneration and regeneration. Sections were immunolabeled with anti-Red Opsin and nuclei were stained blue with TO-PRO-3 (n = 5–6). (T) Graph of transcript pseudo-counts for both paralogs of Red Opsin from 3′mRNA-seq of individual adult zebrafish retinas for each timepoint (n = 6). (U) ImageJ pixel intensity quantification for the Red Opsin signal in the confocal images normalized to 1 demonstrating relative intensity of protein localization within the retina. (V) Overlay of RNA expression for the most highly expressed Red Opsin, opn1lw1, normalized to 1 and ImageJ protein localization normalized to one. Asterisks in paralog keys in (I,T) represent the most dominantly expressed paralog at the 0 h baseline that was also graphed in the merged normalized graphs (K) and (V). Scale bar represents 5 μm.
|
