IMAGE

FIGURE 1

ID
ZDB-IMAGE-211120-15
Source
Figures for Kramer et al., 2021
Image
Figure Caption

FIGURE 1

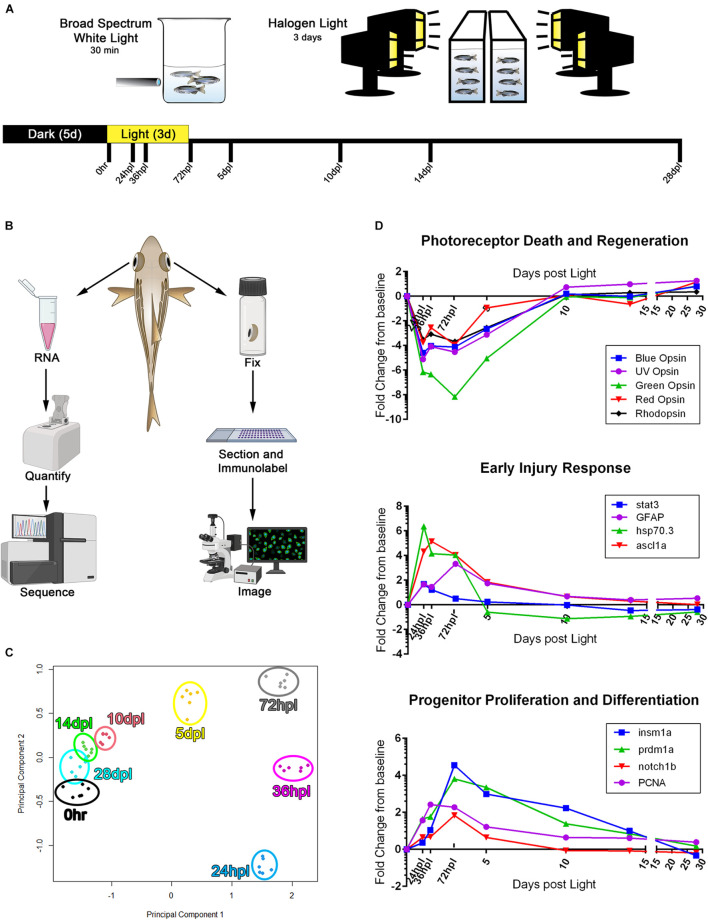
3′mRNA-seq analysis following phototoxic lesion and regeneration confirms gene expression trends known in the field. (A) Experimental design used for phototoxic lesion, with tissue collection time-points along the bottom designated in hours post-light (hpl) and days post-light (dpl). (B) Schematic demonstrating the workflow for tissue collection for each individual fish. (C) Principle component analysis constructed using the top 200 genes differentially regulated as compared to the 0 h baseline. All genes used in the analysis had an FDR < 7.5 × 10− 5. (D) RNA expression fold change from 0 h baseline for three processes of retinal regeneration well described in the literature, demonstrating validation of the 3′mRNA-seq method in determining gene expression changes during the retinal regeneration process. The genes highlighted represent three commonly reported stages in the regeneration process including the degeneration and regeneration of photoreceptors, early responding genes that turn on within 24 hpl, and progenitor cell response genes which peak around 72 hpl. Regeneration of lost photoreceptors is evidenced by the re-emergence of opsin gene expression starting at 5 dpl. For data presented in (C,D), n = 6 biological replicates. With the exception of the zebrafish rendering, all clipart in (B) was downloaded from BioRender.com.

Acknowledgments
This image is the copyrighted work of the attributed author or publisher, and ZFIN has permission only to display this image to its users. Additional permissions should be obtained from the applicable author or publisher of the image. Full text @ Front Cell Dev Biol