IMAGE

FIGURE 6

ID
ZDB-IMAGE-211120-23
Source
Figures for Kramer et al., 2021
Image
Figure Caption

FIGURE 6

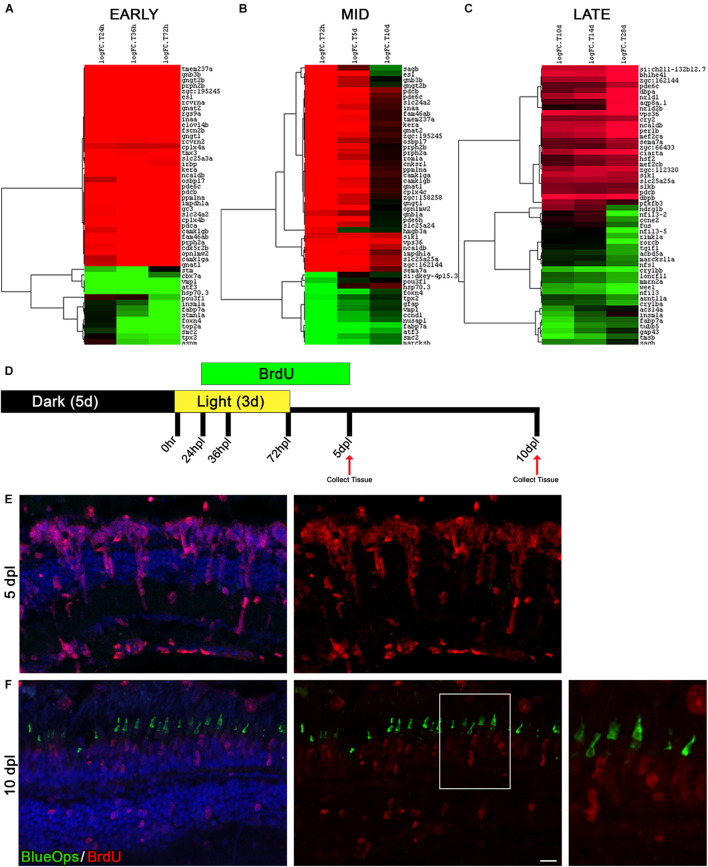
The time window between days 5 and 10 of regeneration represents a distinct turning point toward differentiation. (A–C) A time-course analysis was performed on each of the following three time periods; early response (24, 36, and 72 hpl), mid-regeneration (72 hpl, 5, and 10 dpl), and late-regeneration (10, 14, and 28 dpl). The top 50 genes were run through hierarchical clustering with complete linkage in Gene Cluster 3.0. Genes upregulated from the 0 h baseline are in green and downregulated from the 0 h baseline are in red. All top 50 genes had an FDR < 2 × 10− 9. (D) To trace newly generated cells during the process of regeneration, cells were labeled with BrdU added to the fish water from 24 hpl (prior to MG cell cycle entry) to 5 dpl (past the peak proliferation timepoint) and harvested at 5 and 10 dpl. (E,F) Retinal sections were co-labeled with anti-BrdU (red) and anti-Blue Opsin (green) at 5 dpl (E) and 10 dpl (F). Nuclei were stained blue with TO-PRO-3. We did not observe immunolocalization of Blue Opsin at 5 dpl (E). In contrast, the expansion in the bottom right highlights that the Blue Opsin signal seen in the new outer segments of cones at 10 dpL is coming from the BrdU-positive, newly derived cone photoreceptors as a result of regeneration. The heat map paired with the immunolabeling comparison of the 5–10 dpl timepoints demonstrates that the period of time between 5 and 10 dpl likely represents a major cell fate decision point in which stem cell pathways are being shut down and pro-differentiation pathways are being turned on. Scale bar represents 5 μm.

Acknowledgments
This image is the copyrighted work of the attributed author or publisher, and ZFIN has permission only to display this image to its users. Additional permissions should be obtained from the applicable author or publisher of the image. Full text @ Front Cell Dev Biol