
- Title
-
Genetic, cellular and structural characterization of the membrane potential-dependent cell-penetrating peptide translocation pore
- Authors
- Trofimenko, E., Grasso, G., Heulot, M., Chevalier, N., Deriu, M.A., Dubuis, G., Arribat, Y., Serulla, M., Michel, S., Vantomme, G., Ory, F., Dam, L.C., Puyal, J., Amati, F., Lüthi, A., Danani, A., Widmann, C.
- Source
- Full text @ Elife
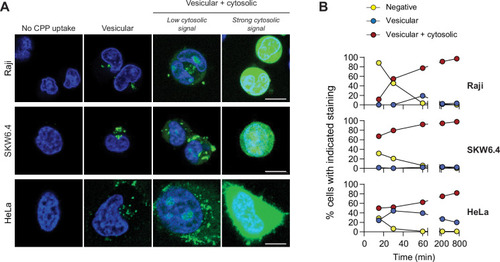
(A) Depiction of the different modes of cell-penetrating peptide (CPP) entry into cells. Confocal microscopy was performed on the indicated cell lines incubated for 1 hr with 40 μM FITC-TAT-RasGAP317-326 in RPMI, 10% fetal bovine serum (FBS). Cells were washed with PBS prior to visualization. Vesicular staining is indicative of CPP endocytosis while diffuse cytosolic staining is a consequence of CPP direct translocation into cells. Scale bar: 10 μm. (B) Quantitation of the different modes of CPP entry as a function of time (FITC-TAT-RasGAP317-326 continually present in the media) using the experimental conditions presented in panel A. Types of staining were visually quantitated as indicated in Figure 1—figure supplement 1A (n = 157 cells per condition). There was no indication of fluorescence quenching, due to endosomal acidification, preventing the detection of CPP-containing endosomes (in at least during the first hour of CPP exposure) (Figure 1—figure supplement 1B). TAT-RasGAP317-326 enters cells via endocytosis and direct translocation, but only direct translocation mediates its biological activity and leads to cell death (Figure 1—figure supplement 4). Results correspond to the average of three independent experiments.
|
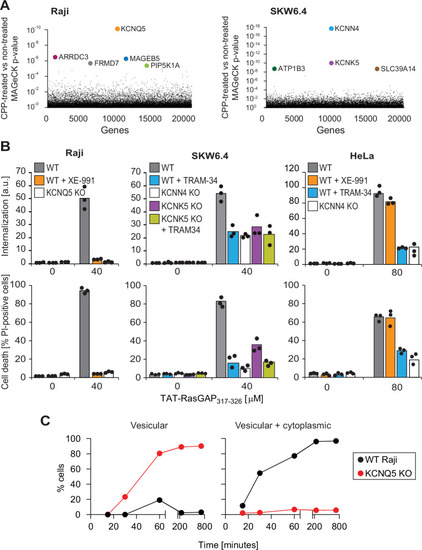
(A) Identification of genes implicated in TAT-RasGAP317-326 internalization in Raji and SKW6.4 cells. The graphs depict the p-value (calculated using the MAGeCK procedure; see Materials and methods) for the difference in sgRNA expression between peptide-treated and control cells for the ~20,000 genes targeted by the CRISPR/Cas9 library. (B) Quantitation of TAT-RasGAP317-326 entry (top) and induced death (bottom) in wild-type (WT) and knock-out (KO) cells. The WT and the corresponding potassium channel KO versions of the indicated cell lines were pretreated or not for 30 min with 10 μM XE-991 or with TRAM-34 and then incubated (still in the presence of the inhibitors when initially added) with or without 40 μM (Raji and SKW6.4 cells) or 80 μM (HeLa cells) TAT-RasGAP317-326. Internalization was recorded after 1 hr and cell death after 16 hr (Raji and SKW6.4) or 24 hr (HeLa). Results correspond to the average of three independent experiments. TAT-RasGAP317-326 concentrations and time of incubation used were adjusted so that the CPP induced similar cell death (between 60% and 90%) in the WT versions of the different cell lines. (C) Quantitation of the modalities of TAT-RasGAP317-326 entry in WT and KCNQ5 KO Raji cells. Cells were incubated with FITC-TAT-RasGAP317-326 for various periods of time and peptide staining was visually quantitated on confocal images (n = 165 cells for each time-point). The high percentage of cells with vesicular staining in the KO cells results from the absence of strong diffuse staining masking endosomes. The results correspond to the average of three experiments.
|
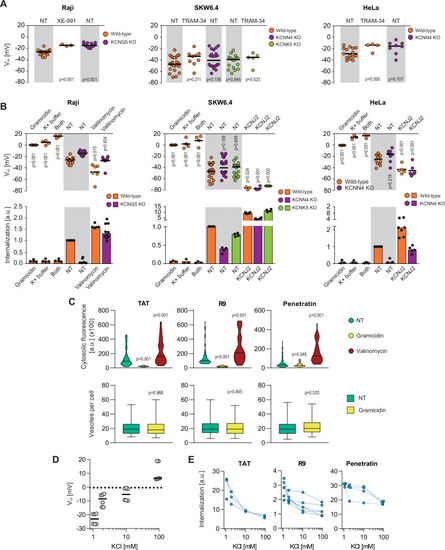
(A) Assessment of the resting plasma membrane potential in the indicated wild-type cell lines and the corresponding potassium channel knock-out (KO) clones in the presence or in the absence 10 μM XE-991 or TRAM-34. The gray and white zones correspond to non-treated cells and inhibitor-treated cells, respectively. NT, not treated. The p-values correspond to the assessment of the significance of the differences with the control wild-type condition using ANOVA multiple comparison analysis with Dunnett’s correction. Each dot in a given condition represents an independent experiment. (B) Effect of cellular depolarization (left of the gray zone) and hyperpolarization (right of the gray zone) on peptide internalization in the absence of serum. The indicated cell lines and the corresponding channel KO clones were pretreated or not with depolarization agents (2 μg/ml gramicidin for 5 min or high extracellular potassium buffer for 30 min) or with hyperpolarization inducer (10 μM valinomycin), followed by the addition of TAT-RasGAP317-326 for 1 hr. Alternatively, hyperpolarization was achieved by ectopic expression of the KCNJ2 potassium channel. Membrane potential and peptide internalization were then determined. Membrane potential was measured in the presence of DiBac4(3) by flow cytometry. Peptide internalization was measured by flow cytometry in the presence of 0.2% trypan blue. The p-values correspond to the assessment of the significance of the differences with the control wild-type condition using ANOVA multiple comparison analysis with Dunnett’s correction. Each dot in a given condition represents an independent experiment. Treatment with valinomycin was used in the absence of serum as the latter is expected to interfere with the drug (Rimmele and Chatton, 2014). As shown in Figure 3—figure supplement 5A, removing serum from the culture medium sensitized cells to TAT-RasGAP317-326 and consequently, the CPP concentration had to be adapted accordingly (Figure 3—figure supplement 5B). Serum withdrawal does not affect the Vm (Figure 3—figure supplement 5C). (C) Quantitation of cytosolic CPP signal (top) and the number of endocytic vesicles per cell (bottom) in wild-type HeLa cells (n = 158 cells) incubated for 1 hr with 10 μM FITC-CPP in control, depolarizing (2 μg/ml gramicidin), or hyperpolarizing (10 μM valinomycin) conditions in the absence of serum based on confocal microscopy images (Figure 3—figure supplement 2D). Comparison between different conditions to non-treated control was done using ANOVA test with Dunnett’s correction for multiple comparison. The number of endocytic vesicles per cell was quantitated based on confocal images. Statistical comparison was done using t-tests. Quantitation of vesicles was not performed in hyperpolarizing conditions due to masking from strong cytosolic signal. (D) Modulation of the Vm membrane potential by varying extracellular potassium concentrations. Assessment of membrane potential changes in Raji cells incubated in RPMI medium containing the indicated concentrations of potassium chloride (isotonicity was maintained by adapting the sodium chloride concentrations; see Materials and methods). Membrane potential was measured with DiBac4(3). The results correspond to the median of six independent experiments. (E) Internalization of various CPPs in the presence of different concentrations of potassium chloride in the media. Data for a given experiment are linked with thin blue lines.
|
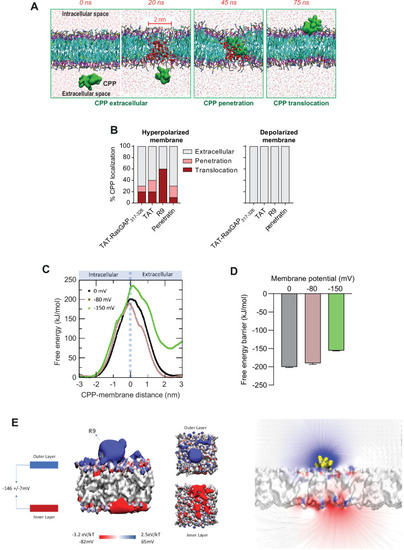
(A) Visualization of in silico modeled, time-dependent, TAT-RasGAP317-326 penetration and subsequent translocation across cellular membrane through a water pore. Water molecules within membranes are depicted by red spheres (and by red dots outside the membrane). (B) Quantitation of CPP localization in hyperpolarized or depolarized conditions based on coarse-grained molecular dynamics simulations. Membrane hyperpolarization was achieved through a net charge difference of 30 positive ions between intracellular and extracellular space in a double-bilayer system (D’Astolfo et al., 2015, Kang et al., 1998; Kauffman et al., 2018; Kelkar and Chattopadhyay, 2007; Khalil et al., 2018) obtaining a transmembrane potential of –2.2 V. Such low membrane potential was required to visualize translocation within the time frame of the simulations (100 ns). (C) Free energy landscape of R9 translocation reported as a function of CPP-membrane distance. The metadynamics simulations were performed at transmembrane potential values of 0, –80, and –150 mV (black, brown, and green curves). (D) Free energy barrier for CPP translocation at different transmembrane potential values. (E) Electrostatic potential map of a molecular system containing one R9 peptide in contact with the cell membrane, without any applied external electrostatic field.
|
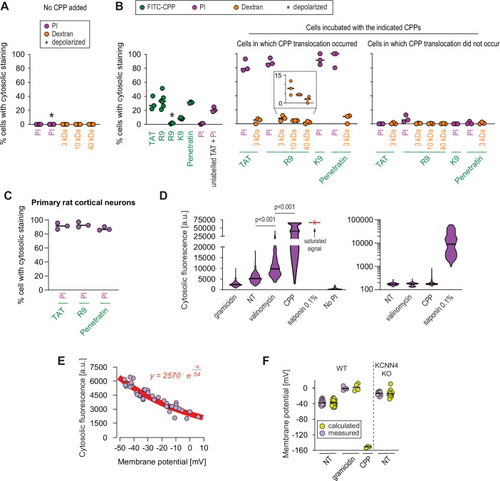
(A–B) Quantitation of the percentage of cells with cytosolic staining after the indicated treatment. The indicated compounds (32 μg/ml propidium iodide [PI], 200 μg/ml dextran, 40 μM CPP) were incubated for 30 min with HeLa cells. Depolarization, indicated by an asterisk, was induced with 2 μg/ml gramicidin. The percentage of cells displaying cytosolic internalization of the indicated molecules was then determined on confocal images (n = 207 cells; see the Materials and methods and Figure 5—figure supplement 1C). Inset corresponds to an enlargement of the percentage of cells positive for dextran in the presence of R9. The results correspond to at least three independent experiments. CPPs such as R9 do not bind to PI (Figure 5—figure supplement 2A) and thus PI entry and accumulation within cells was not the result of CPP carry over. (C) Quantitation of the percentage of primary rat cortical neurons with cytosolic staining following incubation for 30 min with the indicated CPPs (2 μM) and PI (32 μg/ml). The percentage of cells displaying cytosolic internalization of the indicated molecules was then determined on confocal images (n = 153 cells), as in panel B. (D) Left graph: quantitation of PI cytosolic internalization in wild-type HeLa cells after 30 min of incubation in normal, depolarizing (2 μg/ml gramicidin) or hyperpolarizing (10 μM valinomycin) conditions in the presence or in the absence of 40 μM FITC-R9. Right graph: as in left graph, but using lower laser power to avoid saturation of the signal obtained in saponin-permeabilized cells. Cytosolic internalization was quantitated from confocal images using ImageJ (n = 319 cells; see Materials and methods). The p-values correspond to the assessment of the significance of the differences with the non- treated (NT) control condition using ANOVA multiple comparison analysis with Dunnett’s correction. The results correspond to three independent experiments. PI staining is commonly used to assess cell membrane integrity, frequently associated with cell death (see for example Figure 2B, lower graphs). This dye poorly fluoresces in solution (Figure 5—figure supplement 2B). However, the PI cytosolic intensity values in dead permeabilized cells are several orders of magnitude higher than those recorded after cell hyperpolarization (compare the left and right graphs in the present panel). (E) Relation between cytosolic PI intensity and membrane potential measured with the DiBac4(3) sensor in HeLa cells. Each dot represents an independent experiment. (F) The fitted curve from panel E was used to calculate membrane potential values based on cytosolic PI intensities in HeLa cells and its corresponding KCNN4 knock-out (KO). These values are those labelled "calculated" in the graph. Those labelled "measured" correspond to the membrane potentials determined via DiBac4(3) uptake. Each dot in a given condition represents an independent experiment.
|
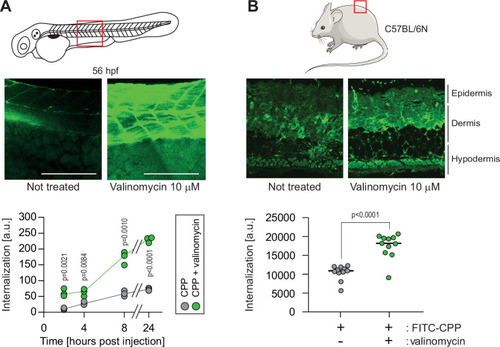
(A) CPP internalization in zebrafish embryos in normal and hyperpolarized conditions. Forty-eight-hour post fertilization, zebrafish embryos were injected with 3.12 μM FITC-TAT-RasGAP317-326(W317A) with or without 10 μM valinomycin. Scale bar: 200 μm. The results correspond to three independent experiments. (B) CPP internalization in C57BL/6 N mice in normal and hyperpolarized conditions. Mice were injected with 5 μM FITC-TAT-RasGAP317-326(W317A) with or without 10 μM valinomycin (n = 11 injections per condition). In both panels, the p-values associated with the comparisons of the ‘CPP’ and ‘CPP + valinomycin’ conditions were calculated using two-tailed paired t-tests.
|
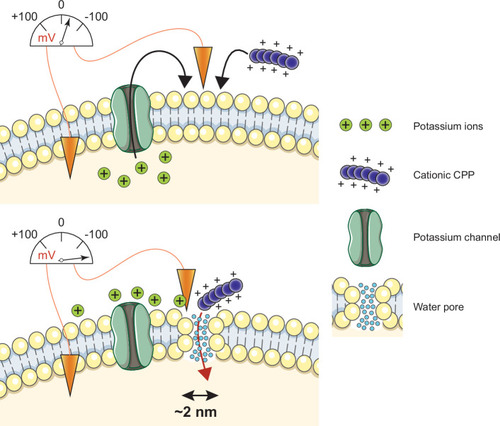
Cationic CPP translocation across cellular membranes is favored by the opening of potassium channels or by hyperpolarizing drugs, such as valinomycin. This sets a sufficiently low membrane potential permissive for CPP direct translocation. When cationic CPPs bind to these already polarized membranes, they induce megapolarization (i.e. a membrane potential estimated to be –150 mV or lower). This leads to the formation of water pores that are then used by CPPs to enter cells.
|