
|
Figure 5
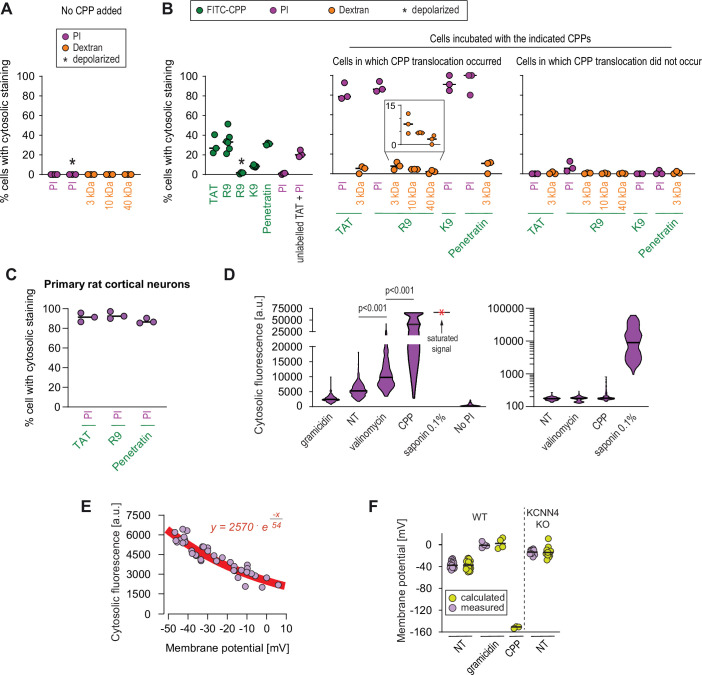
(A–B) Quantitation of the percentage of cells with cytosolic staining after the indicated treatment. The indicated compounds (32 μg/ml propidium iodide [PI], 200 μg/ml dextran, 40 μM CPP) were incubated for 30 min with HeLa cells. Depolarization, indicated by an asterisk, was induced with 2 μg/ml gramicidin. The percentage of cells displaying cytosolic internalization of the indicated molecules was then determined on confocal images (n = 207 cells; see the Materials and methods and Figure 5—figure supplement 1C). Inset corresponds to an enlargement of the percentage of cells positive for dextran in the presence of R9. The results correspond to at least three independent experiments. CPPs such as R9 do not bind to PI (Figure 5—figure supplement 2A) and thus PI entry and accumulation within cells was not the result of CPP carry over. (C) Quantitation of the percentage of primary rat cortical neurons with cytosolic staining following incubation for 30 min with the indicated CPPs (2 μM) and PI (32 μg/ml). The percentage of cells displaying cytosolic internalization of the indicated molecules was then determined on confocal images (n = 153 cells), as in panel B. (D) Left graph: quantitation of PI cytosolic internalization in wild-type HeLa cells after 30 min of incubation in normal, depolarizing (2 μg/ml gramicidin) or hyperpolarizing (10 μM valinomycin) conditions in the presence or in the absence of 40 μM FITC-R9. Right graph: as in left graph, but using lower laser power to avoid saturation of the signal obtained in saponin-permeabilized cells. Cytosolic internalization was quantitated from confocal images using ImageJ (n = 319 cells; see Materials and methods). The p-values correspond to the assessment of the significance of the differences with the non- treated (NT) control condition using ANOVA multiple comparison analysis with Dunnett’s correction. The results correspond to three independent experiments. PI staining is commonly used to assess cell membrane integrity, frequently associated with cell death (see for example Figure 2B, lower graphs). This dye poorly fluoresces in solution (Figure 5—figure supplement 2B). However, the PI cytosolic intensity values in dead permeabilized cells are several orders of magnitude higher than those recorded after cell hyperpolarization (compare the left and right graphs in the present panel). (E) Relation between cytosolic PI intensity and membrane potential measured with the DiBac4(3) sensor in HeLa cells. Each dot represents an independent experiment. (F) The fitted curve from panel E was used to calculate membrane potential values based on cytosolic PI intensities in HeLa cells and its corresponding KCNN4 knock-out (KO). These values are those labelled "calculated" in the graph. Those labelled "measured" correspond to the membrane potentials determined via DiBac4(3) uptake. Each dot in a given condition represents an independent experiment.
Estimation of the size of the pore used by cell-penetrating peptides (CPPs) to enter cells.