
- Title
-
De novo identification of mammalian ciliary motility proteins using cryo-EM
- Authors
- Gui, M., Farley, H., Anujan, P., Anderson, J.R., Maxwell, D.W., Whitchurch, J.B., Botsch, J.J., Qiu, T., Meleppattu, S., Singh, S.K., Zhang, Q., Thompson, J., Lucas, J.S., Bingle, C.D., Norris, D.P., Roy, S., Brown, A.
- Source
- Full text @ Cell
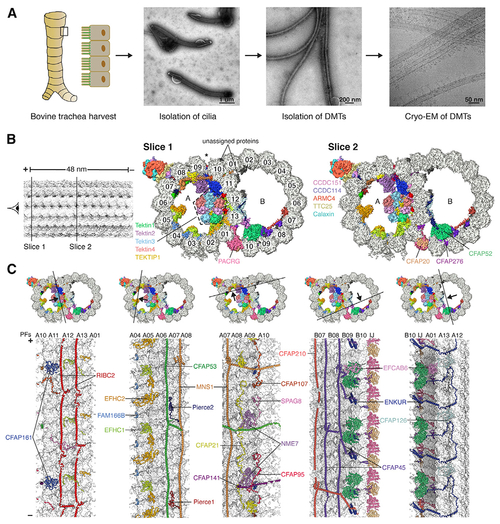
The 48-nm repeat structure of bovine doublet microtubules (DMTs)
(A) Isolation of bovine DMTs for cryo-EM analysis. (B) Two slices through the DMT map, showing density for the MIPs and ODA-DC. Protofilaments are numbered, and the seam of the A tubule is marked with an asterisk. MIP labeling continues in (C). (C) The cross sections (top) show the DMT map colored by subunit, and the longitudinal sections (bottom) show the models of the MIPs, with tubulin in surface representation. Tektins are omitted for clarity in the longitudinal sections. PF, protofilament; IJ, inner junction. In (B) and (C), the minus (−) and plus (+) ends of the DMT are indicated. See also Figures S1 and S2, Tables S1 and S2, and Video S1. |
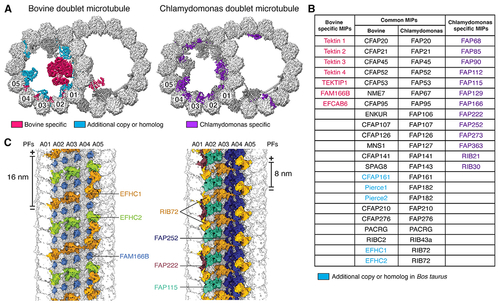
Microtubule inner proteins (MIPs) of mammalian DMTs
(A) Cross-sections of bovine (left) and Chlamydomonas (right) DMTs, with MIPs colored by conservation. MIPs present in both organisms are colored dark gray. (B) Table of MIPs identified in bovine and Chlamydomonas DMTs. Protein names are colored according to their classification in (A). The names of shared MIPs are given for bovine and C. reinhardtii. (C) View from the A-tubule lumen showing bovine (left) and Chlamydomonas (right) MIPs bound to PFs A01–A05. Chlamydomonas RIB72 repeats every 8 nm, whereas its two bovine paralogs, EFHC1 and EFHC2, repeat every 16 nm. See also Video S1. |
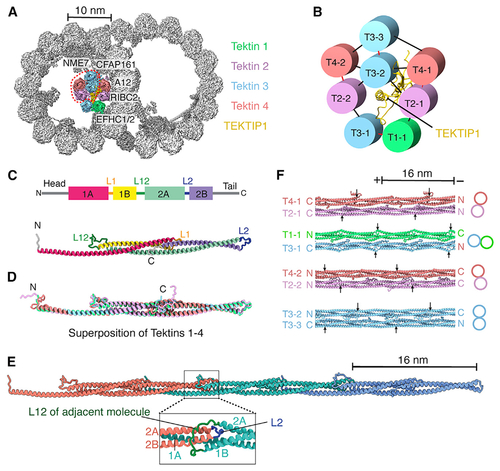
Tracheal DMTs contain a luminal bundle of tektin filaments
(A) Cross-section of the bovine DMT, showing a luminal bundle of tektin filaments. The luminal-most tektin filaments (circled) are absent from some particles. The MIPs and PF A12 that interact with tektins are labeled. (B) Interaction network showing the pentagonal organization of tektin paralogs and TEKTIP1. Intradimer contacts are shown in red, and interdimer contacts are shown in black. (C) Secondary structure profile (top) and tertiary structure (bottom) of a tektin 1 monomer. (D) Superposition of tektin paralogs. The conserved rod domains superpose with a root-mean-square deviation (RMSD) of 1.0–1.7 Å. (E) Quaternary structure of a tektin filament. The expanded view shows the L12 loop clamping around the L2 loop of an adjacent molecule. (F) Interactions between tektin dimers as they occur in a section of the 8-tektin bundle. Filament orientation is indicated by labeling their N and C termini. Arrows mark the start of helix 1A in each tektin molecule to show the offsets in their registry. The two T2:T4 heterodimers are identical except that their N and C termini adopt different conformations because of the interactions they make within the bundle. See also Figures S3 and S4, Table S1, and Video S1. |
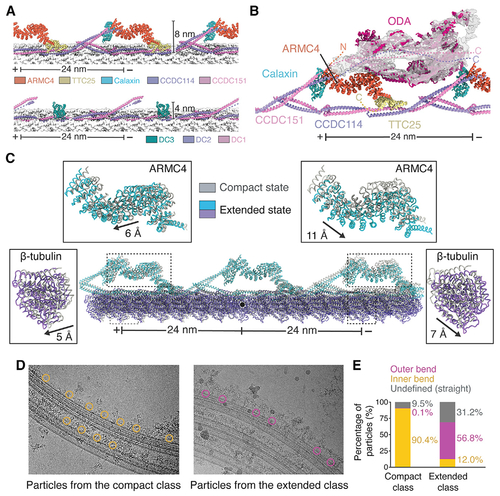
Structure and dynamics of the mammalian outer dynein arm (ODA) and ODA docking complex (ODA-DC)
(A) Models of bovine (top) and Chlamydomonas (bottom) ODA-DCs. Tubulin is shown in surface representation. (B) Model of the Chlamydomonas ODA (PDB: 7KZM) docked into the cryo-EM map of the bovine ODA. Dashed lines represent the predicted locations of the termini of ODA-DC subunits when ODA is bound. (C) Analysis of tubulin lattice spacing reveals an extended and compact conformation with different ODA-DC conformations. The two models are superposed on the central tubulin (marked with a black circle). The displacement of ARMC4 and β-tubulin between classes was calculated using the mass center of the molecules. (D) Particles from the compact and extended classes mapped back onto the micrographs. (E) Quantification of the particle locations observed in (D). Only micrographs with 8 or more particles were analyzed. Compact class, n = 1,017; extended class, n = 1,201. See also Figure S4 and Video S2. |
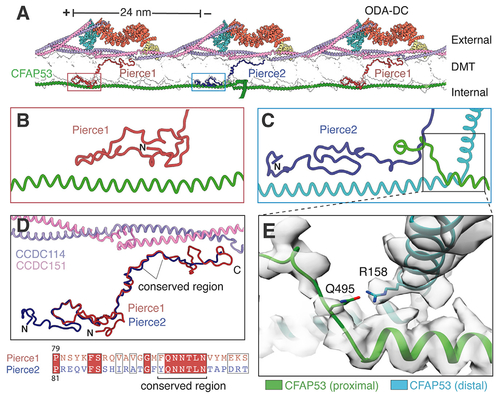
Pierce1 and Pierce2 link the ODA-DC to the MIP architecture
(A) Atomic model showing Pierce1 and Pierce2 spanning the microtubule wall (shown in transparent surface representation) and linking the external ODA-DC to the filamentous MIP CFAP53. (B and C) Interaction of the Pierce1 (B) and Pierce2 (C) N termini with CFAP53. (D) Superposition of Pierce1 and Pierce2. A conserved central region interacts with the CCDC114/151 coiled coil. The sequence alignment of this conserved region is shown beneath. (E) Expanded view showing a potential hydrogen bond between two neighboring CFAP53 molecules involving R158 and Q495. Mutation of R158 to glycine has been implicated casually in dextrocardia (Noël et al., 2016). See also Video S1. |
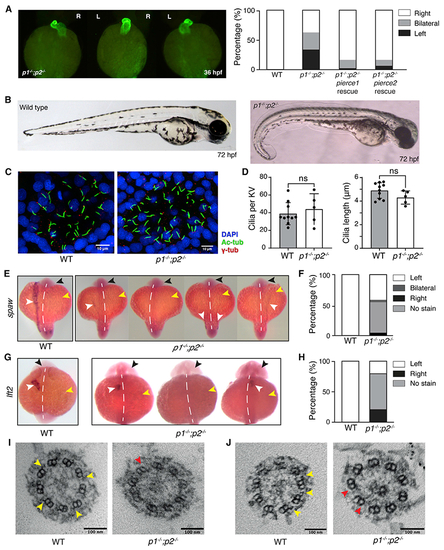
Laterality defects in pierce1; pierce2 (p1−/−;p2−/−) double-mutant zebrafish embryos
(A) Left: Immunofluorescence (IF) microscopy showing heart jogging directionality at 36 hpf. Images from left to right show the three heart jogging directions observed when imaged ventrally: rightward jogging (normal situs), bilateral jogging, and leftward jogging. Right: quantification of heart jogging directionality in WT (n = 61) and p1−/−;p2−/− (n = 72) embryos and p1−/−;p2−/− embryos following injection of pierce1 (n = 43) or pierce2 (n = 47) mRNA. (B) Bright-field images of WT (left) and p1−/−;p2−/− (right) embryos at 72 hpf. (C) IF of KVs of WT (left) and p1−/−;p2−/− (right) embryos using antibodies against acetylated tubulin (labeling axonemes), γ-tubulin (labeling basal bodies), and DAPI (labeling nuclei). (D) Quantification of cilium numberand length per KV in WT and p1−/−;p2−/− embryos. Data are represented as mean ± SD (standard deviation). Unpaired t test was used to evaluate significance. (E) Whole-mount in situ hybridization for spaw on WT and p1−/−;p2−/− embryos at the 18-somite stage. The black arrow indicates the head, the yellow arrow indicates the yolk, and the white arrow indicates the stain. The white dashed line indicates the embryonic midline. For p1−/−;p2−/− embryos, expression on the left, no expression, bilateral and right expression, respectively, are depicted. (F) Quantification of spaw expression for WT (n = 36) and p1−/−;p2−/− (n = 20) embryos. (G) Whole-mount in situ hybridization for lft2 on WT and p1−/−;p2−/− embryos at the 22-somite stage. Arrows and labeling are as in (E). (H) Quantification of lft2 expression for WT (n = 62) and p1−/−;p2−/− (n = 43) embryos. (I and J) Micrographs showing cross-sections from 9+0 (I) and 9+2 (J) KV cilia from WT and p1−/−;p2−/− embryos. Yellow arrows indicate examples of ODAs, which are missing from p1−/−;p2−/− embryos (red arrows). In p1−/−;p2−/− embryos (n = 2), all 7 KV cilia examined lacked ODAs. See also Figure S5, Table S3, and Video S3. EXPRESSION / LABELING:
PHENOTYPE:
|
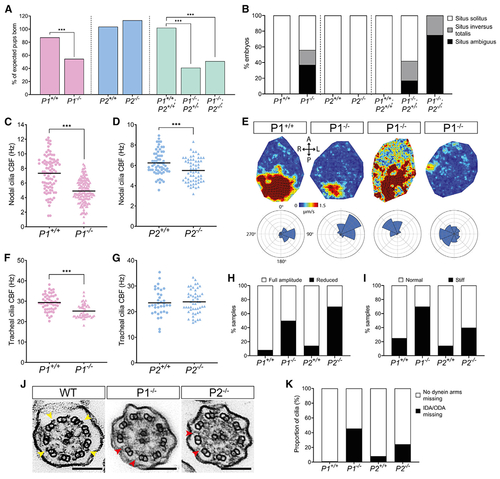
Pierce1-deficient mice have aberrant nodal and tracheal cilia motility
(A) Pierce1 (P1)−/− and P1−/−;P2−/− double knockout mice have high embryonic lethality, whereas P2−/− mice do not. All other genotypes were born at the expected frequencies. Chi-square analysis was used to evaluate significance. (B) P1−/− and P1−/−;P2−/− embryos have visceral organ situs defects. A bar chart shows the proportion of embryos displaying situs solitus (normal organ positioning), situs inversus totalis (total inversion to normal), and situs ambiguus (abnormal organ positioning) for each genotype at E13.5. P1+/+ (n = 16), P1−/− (n = 16), P2+/+ (n = 9), P2−/− (n = 10), P1+/+;P2+/+ (n = 7), P1−/−;P2+/− (n = 12) and P1−/−;P2−/− (n = 8) are shown. All other genotypes displayed only situs solitus. (C and D) Nodal cilia beat frequency (CBF) is reduced significantly in P1−/− and P2−/− embryos at E8.0. Average CBF is 7.3 Hz versus 4.9 Hz (P1+/+ versus P1−/−) and 5.9 Hz versus 5.1 Hz (P2+/+ versus P2−/−). Numbers of embryos analyzed are 19, 36, 9, and 8 for P1+/+, P1−/−, P2+/+, and P2−/−, respectively. CBFs of 5–10 cilia were quantified per node. ***p < 0.001 Student’s t test. Heterozygous genotypes did not show significant differences in their mean CBF. (E) Mean fluid velocity is reduced and/or directionality is abnormal in P1−/− embryonic nodes at E8.0. Dark red refers to high velocity (1.5 μm/s), and dark blue refers to low velocity (0 μm/s). Localized directionality of flow is shown by black arrows. Anterior (A), posterior (P), left (L), and right (R) axes are annotated. Overall directionality of flow is depicted in rose plots in the bottom panel; vector direction is indicated in 8 directional segments, with the number of vectors indicated by the size of the segment. P1+/+ (n = 8) embryos display an organized, leftward nodal fluid flow, whereas P1−/− (n = 8) embryos show a range of unusual phenotypes, including leftward flow (n = 2), disordered flow (n = 4), and weak flow with no overall directionality (n = 2) (panels from left to right). P1+/− did not differ compared with WT embryos. (F and G) Tracheal CBF is reduced in P1−/− but not P2−/− mice. Average CBF is 29.4 Hz versus 25.2 Hz (P1+/+ versus P1−/−) and 23.4 Hz versus 23.8 Hz (P2+/+ versus P2−/−). 7–11 trachea were harvested for each genotype, with 5 ring sections assessed per trachea. ***p < 0.001 Student’s t test. P2+/− mean CBF did not differ compared with WT embryos. (H and I) Tracheal cilia beat pattern is disrupted in P1−/− and P2−/− adult mice. Bar charts show the proportion of P1+/+ (n = 12), P1−/− (n = 10), P2+/+ (n = 7), and P2−/− (n = 10) trachea displaying cilia with a reduced beat amplitude (H) and a stiff waveform (I). P1+/− and P2+/− did not differ compared with the WT. (J) TEM of tracheal cilia cross-sections from WT, P1−/−, and P2−/− mice. Yellow arrows on the WT image indicate ODAs, whereas red arrows in the P1−/− and P2−/− images indicate missing dynein arm(s). Scale bars, 100 nm. (K) Quantification of dynein arm defects observed in adult mouse tracheal cilia from P1+/+ (n = 3,387 cilia), P1−/− (n = 4,597 cilia), P2+/+ (n = 3,604 cilia), and P2−/− (n = 3, 540 cilia) genotypes. ~46% of P1−/− and ~24% of P2−/− tracheal cilia axonemes have missing dynein arms. Micrographs were assessed by three independent evaluators blind to genotype. See also Figure S6, Table S3, and Videos S4 and S5. |
Reprinted from Cell, 184(23), Gui, M., Farley, H., Anujan, P., Anderson, J.R., Maxwell, D.W., Whitchurch, J.B., Botsch, J.J., Qiu, T., Meleppattu, S., Singh, S.K., Zhang, Q., Thompson, J., Lucas, J.S., Bingle, C.D., Norris, D.P., Roy, S., Brown, A., De novo identification of mammalian ciliary motility proteins using cryo-EM, 5791-5806.e19, Copyright (2021) with permission from Elsevier. Full text @ Cell