
Figure 6.
- ID
- ZDB-FIG-211120-12
- Publication
- Gui et al., 2021 - De novo identification of mammalian ciliary motility proteins using cryo-EM
- Other Figures
- All Figure Page
- Back to All Figure Page
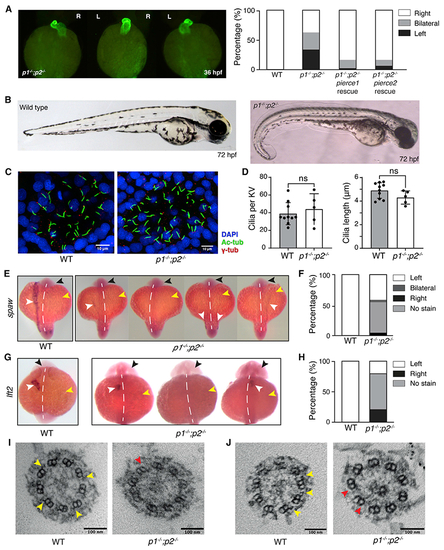
Laterality defects in pierce1; pierce2 (p1−/−;p2−/−) double-mutant zebrafish embryos
(A) Left: Immunofluorescence (IF) microscopy showing heart jogging directionality at 36 hpf. Images from left to right show the three heart jogging directions observed when imaged ventrally: rightward jogging (normal situs), bilateral jogging, and leftward jogging. Right: quantification of heart jogging directionality in WT (n = 61) and p1−/−;p2−/− (n = 72) embryos and p1−/−;p2−/− embryos following injection of pierce1 (n = 43) or pierce2 (n = 47) mRNA. (B) Bright-field images of WT (left) and p1−/−;p2−/− (right) embryos at 72 hpf. (C) IF of KVs of WT (left) and p1−/−;p2−/− (right) embryos using antibodies against acetylated tubulin (labeling axonemes), γ-tubulin (labeling basal bodies), and DAPI (labeling nuclei). (D) Quantification of cilium numberand length per KV in WT and p1−/−;p2−/− embryos. Data are represented as mean ± SD (standard deviation). Unpaired t test was used to evaluate significance. (E) Whole-mount in situ hybridization for spaw on WT and p1−/−;p2−/− embryos at the 18-somite stage. The black arrow indicates the head, the yellow arrow indicates the yolk, and the white arrow indicates the stain. The white dashed line indicates the embryonic midline. For p1−/−;p2−/− embryos, expression on the left, no expression, bilateral and right expression, respectively, are depicted. (F) Quantification of spaw expression for WT (n = 36) and p1−/−;p2−/− (n = 20) embryos. (G) Whole-mount in situ hybridization for lft2 on WT and p1−/−;p2−/− embryos at the 22-somite stage. Arrows and labeling are as in (E). (H) Quantification of lft2 expression for WT (n = 62) and p1−/−;p2−/− (n = 43) embryos. (I and J) Micrographs showing cross-sections from 9+0 (I) and 9+2 (J) KV cilia from WT and p1−/−;p2−/− embryos. Yellow arrows indicate examples of ODAs, which are missing from p1−/−;p2−/− embryos (red arrows). In p1−/−;p2−/− embryos (n = 2), all 7 KV cilia examined lacked ODAs. See also Figure S5, Table S3, and Video S3. |
| Genes: | |
|---|---|
| Antibodies: | |
| Fish: | |
| Anatomical Terms: | |
| Stage Range: | 10-13 somites to Prim-25 |
| Fish: | |
|---|---|
| Observed In: | |
| Stage Range: | 10-13 somites to Protruding-mouth |
Reprinted from Cell, 184(23), Gui, M., Farley, H., Anujan, P., Anderson, J.R., Maxwell, D.W., Whitchurch, J.B., Botsch, J.J., Qiu, T., Meleppattu, S., Singh, S.K., Zhang, Q., Thompson, J., Lucas, J.S., Bingle, C.D., Norris, D.P., Roy, S., Brown, A., De novo identification of mammalian ciliary motility proteins using cryo-EM, 5791-5806.e19, Copyright (2021) with permission from Elsevier. Full text @ Cell