
- Title
-
Cardioluminescence in Transgenic Zebrafish Larvae: A Calcium Imaging Tool to Study Drug Effects and Pathological Modeling
- Authors
- Vicente, M., Salgado-Almario, J., Collins, M.M., Martínez-Sielva, A., Minoshima, M., Kikuchi, K., Domingo, B., Llopis, J.
- Source
- Full text @ Biomedicines
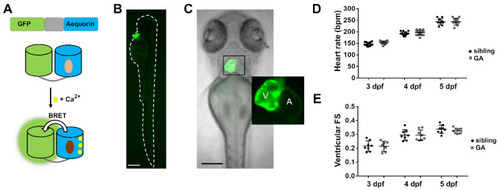
Expression of GA in the heart of zebrafish larvae. (A) DNA construct of the chimera GA and scheme of Ca2+-dependent bioluminescence. BRET, bioluminescence resonance energy transfer. Light and dark brown ovals represent CTZ and its excited state product. (B) GFP fluorescence of a 3 dpf Tg(myl7:GA) zebrafish larva. (C) Superimposed GFP fluorescence and transmitted light images of a 3 dpf Tg(myl7:GA) zebrafish larva. The inset shows the atrium (A) and ventricle (V). (D) HR of GA heterozygous and wild-type siblings at 3, 4, and 5 dpf. Data are shown as mean ± SD (n = 17 for 3 and 4 dpf; n = 10 for 5 dpf). (E) Ventricular fractional shortening (FS), measured with the major diameter, of GA heterozygous and sibling larvae at 3, 4, and 5 dpf. Data are shown as mean ± SD (sibling n = 8 for 3, 4, and 5 dpf; GA n = 7 for 3, n = 8 for 4 dpf and n = 9 for 5 dpf). Statistical analysis was performed using an unpaired t-test in (D) and (E) and no statistical differences were found between GA-expressing and sibling larvae (p > 0.05). The bar scale in (B) and (C) indicates 250 µm and 150 µm, respectively. |
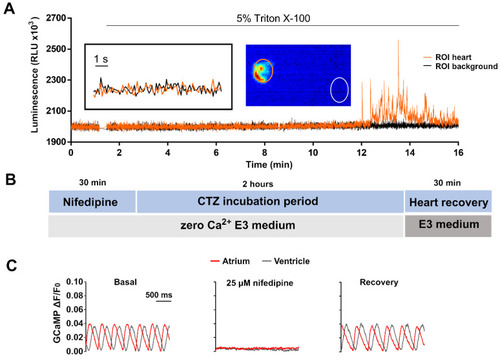
Limiting Ca2+ transients in the heart with nifedipine and aequorin reconstitution protocol. (A) Representative luminescence of a beating heart in a 3 dpf Tg(myl7:GA) larva incubated with 50 µM diacetyl h-CTZ in E3 medium for 2 h. Images were acquired at 9 Hz. The image represents the integrated luminescence of the entire experiment, including Triton X-100. Regions of interest (ROI) from heart and background are shown. (B) Scheme of the aequorin reconstitution protocol comprising a 30-min incubation with nifedipine in E30Ca medium to block Ca2+ transients, 2 h for aequorin reconstitution with CTZ, and 30 min for recovery of the Ca2+ transients in Ca2+-containing E3 medium. (C) Representative Ca2+ transients of a 3 dpf Tg(myl7:GCaMP)s878 larva in basal conditions incubated with 25 μM nifedipine for 30 min in E30Ca medium, and after the heart recovery period. The fluorescence images were acquired at 200 Hz in a spinning disk confocal microscope; GCaMP fluorescence was measured in a ROI drawn over the ventricle. |
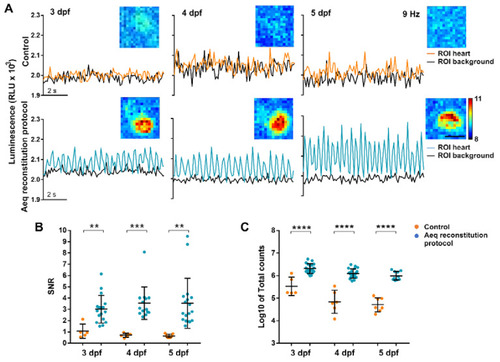
Bioluminescence imaging in the heart of 3, 4, and 5 dpf Tg(myl7:GA) zebrafish larvae treated with the aequorin reconstitution protocol. Diacetyl h-CTZ was used for reconstitution and images were acquired at 9 Hz. (A) Luminescence of CTZ-incubated larvae either with the aequorin reconstitution protocol or in full E3 medium (control). The black lines indicate the luminescence in background ROIs drawn out of the larvae; orange and blue lines show ventricular luminescence. Inset images show the integrated luminescence for 1 min over the heart. The scale bar represents 50 µm and the colour scale indicates RLU. (B) SNR of the control (orange) and aequorin reconstitution protocol (blue) larvae at 3, 4, and 5 dpf. Data are shown as mean ± SD (control n = 5 for 3 dpf, n = 6 for 4 dpf, and n = 7 for 5 dpf; aequorin reconstitution protocol n = 17 for 3 dpf; n = 14 for 4 dpf, and n = 18 for 5 dpf). (C) Log10 of total counts released in the control (orange) and aequorin reconstitution protocol (blue) groups at 3, 4, and 5 dpf. Data are shown as mean ± SD (control n = 5 for 3 dpf, n = 6 for 4 dpf, and n = 7 for 5 dpf; aequorin reconstitution protocol n = 19 for 3 dpf; n = 21 for 4 dpf, and n = 10 for 5 dpf). Statistical analysis was performed using a two-tailed unpaired t-test in (b) and (c). ** p < 0.01; *** p < 0.001 and **** p < 0.0001. |
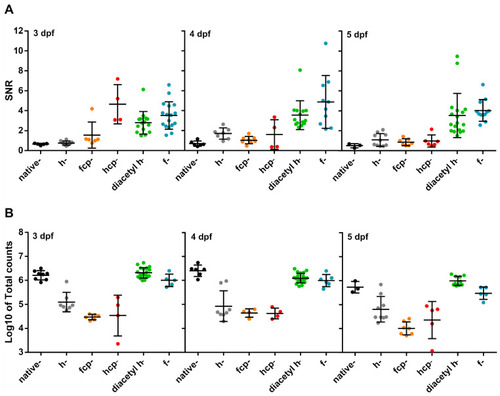
Test of CTZ analogues in 3, 4, and 5 dpf Tg(myl7:GA) zebrafish larvae. (A) SNR from larvae incubated with the CTZ analogues for 2 h with the aequorin reconstitution protocol. Images were acquired at 9 Hz. (Native-CTZ n = 5, 6, and 3; h-CTZ n = 10, 7, and 10; fcp-CTZ n = 6, 8, and 7; hcp-CTZ n = 4, 4, and 5; diacetyl h-CTZ n = 15, 14, and 18; and f-CTZ n = 17, 10, and 12; for 3, 4, and 5 dpf, respectively). Data are shown as mean ± SD. (B) Total counts released by the addition of 5% Triton X-100 in larvae incubated with the CTZ analogues for 2 h. (Native-CTZ n = 8, 6, and 3; h-CTZ n = 7, 8, and 9; fcp-CTZ n = 6, 4, and 7; hcp-CTZ n = 4, 4, and 5; diacetyl h-CTZ n = 19, 21, and 10; and f-CTZ n = 5, 6, and 5; for 3, 4, and 5 dpf, respectively). Data are shown as mean ± SD of Log10 of total counts. |
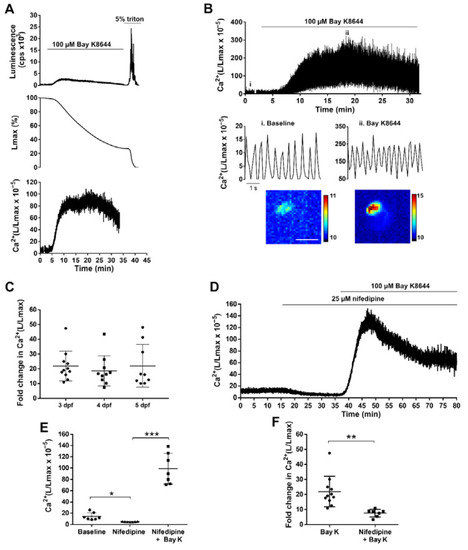
Effect of LTCC activator and antagonist on ventricular Ca2+ dynamics of 3, 4, and 5 dpf Tg(myl7:GA) zebrafish larvae. (A) Analysis of a bioluminescence experiment (3 dpf larva) in which 100 µM Bay K8644 was added from 2 to 33 min, followed by Triton X-100 incubation to release all remaining luminescence counts. Upper panel: Luminescence in counts per s (L, cps); middle panel: remaining counts along the experiment (% of Lmax). Lower panel: L/Lmax, which is proportional to Ca2+ levels. Images were acquired at 2 Hz. (B) Effect of 100 μM Bay K8644 on the ventricular Ca2+ levels. Images were acquired at 9 Hz. The lower panels zoom in the baseline (i) and 100 μM Bay K8644 (ii, min 19). Images of the integrated luminescence during 1 min in baseline and 100 μM Bay K8644 (min 19–20) are shown below. The scale bar represents 100 µm and the colour scale indicates RLU. (C) Maximal fold change of the L/Lmax value over basal of larvae treated with 100 μM Bay K8644 at 3, 4, and 5 dpf. Statistical analysis was performed using a one-way ANOVA with Holm–Sidak post hoc correction for multiple comparisons and multiple t-tests. Data are shown as mean ± SD (n = 11 for 3 and 4 dpf, and n = 9 for 5 dpf). (D) Representative experiment showing the effect of 25 µM nifedipine followed by 100 µM Bay K8644 in a 3 dpf larva. Images were acquired at 1 Hz. (E) Maximal effect of 25 µM nifedipine and 100 µM Bay K8644 on ventricular Ca2+ levels in 3 dpf larvae treated as in (D). Statistical analysis was performed using a repeated measures one-way ANOVA test. Data are shown as mean ± SD (n = 7). (F) Fold change in Ca2+ (L/Lmax) of 100 µM Bay K 8644 in the absence (n = 11) or presence (n = 7) of 25 µM nifedipine. Statistical analysis was performed using a two-tailed unpaired t-test. Data are shown as mean ± SD. All experiments in this figure were performed with diacetyl h-CTZ. * p < 0.05, ** p < 0.01 and *** p < 0.001. |
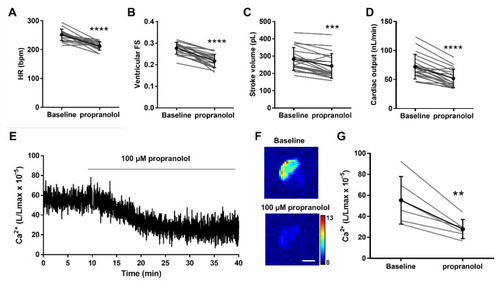
Effect of the β-adrenergic antagonist propranolol on hemodynamic parameters and ventricular Ca2+ levels in 4 dpf Tg(myl7:GA) zebrafish larvae. Heart rate (HR) (A), ventricular fractional shortening (FS) measured with the major diameter (B), stroke volume (C), and cardiac output (D) before (baseline) and after 30 min incubation with 100 µM propranolol. Data are shown as mean ± SD (n = 20). (E) Representative experiment of the effect of 100 µM propranolol on ventricular Ca2+ levels (L/Lmax) (1 Hz image acquisition frequency). (F) The images show the integrated luminescence from baseline (min 0–10) and propranolol (min 30–40) periods of the experiment in (E). The scale bar represents 100 µm and the colour scale indicates RLU. (G) Ca2+ levels (L/Lmax) after 30 min of treatment with 100 µM propranolol. Data are shown as mean ± SD (n = 6). These experiments were performed using diacetyl h-CTZ. Statistical analysis was performed using a two-tailed paired t-test. ** p <0.01, *** p < 0.001 and **** p < 0.0001. |
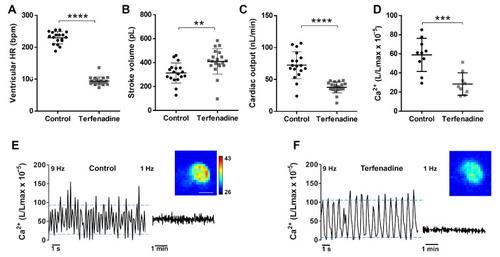
Hemodynamic parameters and Ca2+ levels in a terfenadine-induced heart failure model. Tg(myl7:GA) larvae (3 dpf) were treated with 10 µM terfenadine for 24 h. Ventricular HR (A), stroke volume (B), and cardiac output (C) of control and terfenadine-treated larvae. Data are shown as mean ± SD (n = 18 in control and n = 19 in terfenadine). (D) Time-averaged Ca2+ levels (L/Lmax) of control and terfenadine-treated larvae (1 Hz image acquisition frequency). Data are shown as mean ± SD (n = 7 in both groups). Representative experiments of control sibling (E) and terfenadine-treated (F) larvae showing individual Ca2+ transients (9 Hz image acquisition, left part of traces) and the time-averaged levels (1 Hz image acquisition, right part of traces). Upper and lower blue lines indicate the average systolic and diastolic levels. Images of the integrated luminescence during 1 min are shown. The luminescence experiments shown in D, E, and F were performed using diacetyl h-CTZ. The scale bar (E) represents 100 µm and the colour scale indicates RLU. Statistical analysis was performed using a two-tailed unpaired t-test. ** p < 0.01; *** p < 0.001 and **** p < 0.0001. |