
|
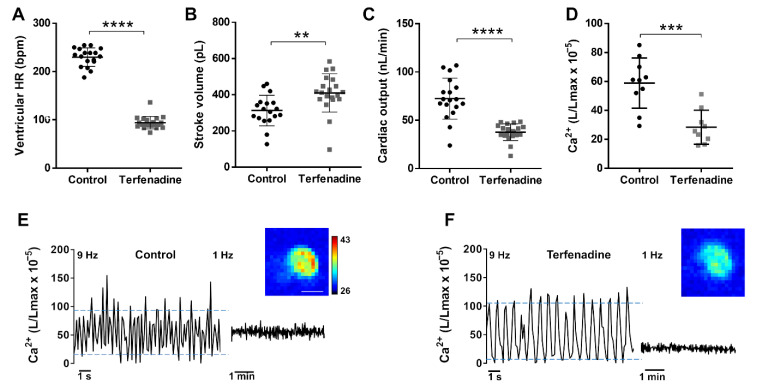
Figure 7 Hemodynamic parameters and Ca2+ levels in a terfenadine-induced heart failure model. Tg(myl7:GA) larvae (3 dpf) were treated with 10 µM terfenadine for 24 h. Ventricular HR (A), stroke volume (B), and cardiac output (C) of control and terfenadine-treated larvae. Data are shown as mean ± SD (n = 18 in control and n = 19 in terfenadine). (D) Time-averaged Ca2+ levels (L/Lmax) of control and terfenadine-treated larvae (1 Hz image acquisition frequency). Data are shown as mean ± SD (n = 7 in both groups). Representative experiments of control sibling (E) and terfenadine-treated (F) larvae showing individual Ca2+ transients (9 Hz image acquisition, left part of traces) and the time-averaged levels (1 Hz image acquisition, right part of traces). Upper and lower blue lines indicate the average systolic and diastolic levels. Images of the integrated luminescence during 1 min are shown. The luminescence experiments shown in D, E, and F were performed using diacetyl h-CTZ. The scale bar (E) represents 100 µm and the colour scale indicates RLU. Statistical analysis was performed using a two-tailed unpaired t-test. ** p < 0.01; *** p < 0.001 and **** p < 0.0001.