
Figure 5
- ID
- ZDB-FIG-211029-232
- Publication
- Vicente et al., 2021 - Cardioluminescence in Transgenic Zebrafish Larvae: A Calcium Imaging Tool to Study Drug Effects and Pathological Modeling
- Other Figures
- All Figure Page
- Back to All Figure Page
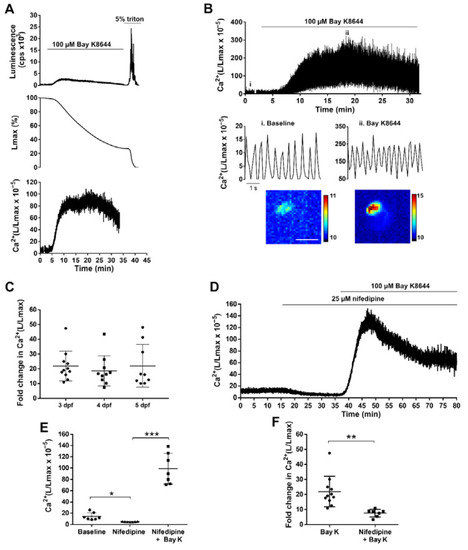
Effect of LTCC activator and antagonist on ventricular Ca2+ dynamics of 3, 4, and 5 dpf Tg(myl7:GA) zebrafish larvae. (A) Analysis of a bioluminescence experiment (3 dpf larva) in which 100 µM Bay K8644 was added from 2 to 33 min, followed by Triton X-100 incubation to release all remaining luminescence counts. Upper panel: Luminescence in counts per s (L, cps); middle panel: remaining counts along the experiment (% of Lmax). Lower panel: L/Lmax, which is proportional to Ca2+ levels. Images were acquired at 2 Hz. (B) Effect of 100 μM Bay K8644 on the ventricular Ca2+ levels. Images were acquired at 9 Hz. The lower panels zoom in the baseline (i) and 100 μM Bay K8644 (ii, min 19). Images of the integrated luminescence during 1 min in baseline and 100 μM Bay K8644 (min 19–20) are shown below. The scale bar represents 100 µm and the colour scale indicates RLU. (C) Maximal fold change of the L/Lmax value over basal of larvae treated with 100 μM Bay K8644 at 3, 4, and 5 dpf. Statistical analysis was performed using a one-way ANOVA with Holm–Sidak post hoc correction for multiple comparisons and multiple t-tests. Data are shown as mean ± SD (n = 11 for 3 and 4 dpf, and n = 9 for 5 dpf). (D) Representative experiment showing the effect of 25 µM nifedipine followed by 100 µM Bay K8644 in a 3 dpf larva. Images were acquired at 1 Hz. (E) Maximal effect of 25 µM nifedipine and 100 µM Bay K8644 on ventricular Ca2+ levels in 3 dpf larvae treated as in (D). Statistical analysis was performed using a repeated measures one-way ANOVA test. Data are shown as mean ± SD (n = 7). (F) Fold change in Ca2+ (L/Lmax) of 100 µM Bay K 8644 in the absence (n = 11) or presence (n = 7) of 25 µM nifedipine. Statistical analysis was performed using a two-tailed unpaired t-test. Data are shown as mean ± SD. All experiments in this figure were performed with diacetyl h-CTZ. * p < 0.05, ** p < 0.01 and *** p < 0.001. |