
Figure 3
- ID
- ZDB-FIG-211029-230
- Publication
- Vicente et al., 2021 - Cardioluminescence in Transgenic Zebrafish Larvae: A Calcium Imaging Tool to Study Drug Effects and Pathological Modeling
- Other Figures
- All Figure Page
- Back to All Figure Page
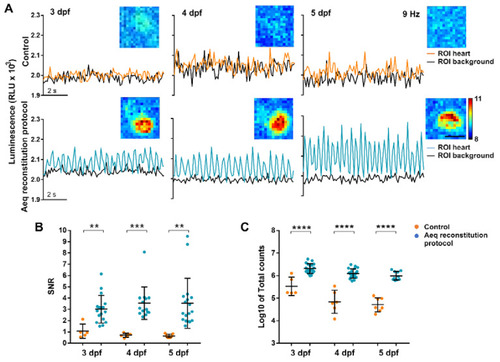
Bioluminescence imaging in the heart of 3, 4, and 5 dpf Tg(myl7:GA) zebrafish larvae treated with the aequorin reconstitution protocol. Diacetyl h-CTZ was used for reconstitution and images were acquired at 9 Hz. (A) Luminescence of CTZ-incubated larvae either with the aequorin reconstitution protocol or in full E3 medium (control). The black lines indicate the luminescence in background ROIs drawn out of the larvae; orange and blue lines show ventricular luminescence. Inset images show the integrated luminescence for 1 min over the heart. The scale bar represents 50 µm and the colour scale indicates RLU. (B) SNR of the control (orange) and aequorin reconstitution protocol (blue) larvae at 3, 4, and 5 dpf. Data are shown as mean ± SD (control n = 5 for 3 dpf, n = 6 for 4 dpf, and n = 7 for 5 dpf; aequorin reconstitution protocol n = 17 for 3 dpf; n = 14 for 4 dpf, and n = 18 for 5 dpf). (C) Log10 of total counts released in the control (orange) and aequorin reconstitution protocol (blue) groups at 3, 4, and 5 dpf. Data are shown as mean ± SD (control n = 5 for 3 dpf, n = 6 for 4 dpf, and n = 7 for 5 dpf; aequorin reconstitution protocol n = 19 for 3 dpf; n = 21 for 4 dpf, and n = 10 for 5 dpf). Statistical analysis was performed using a two-tailed unpaired t-test in (b) and (c). ** p < 0.01; *** p < 0.001 and **** p < 0.0001. |