
|
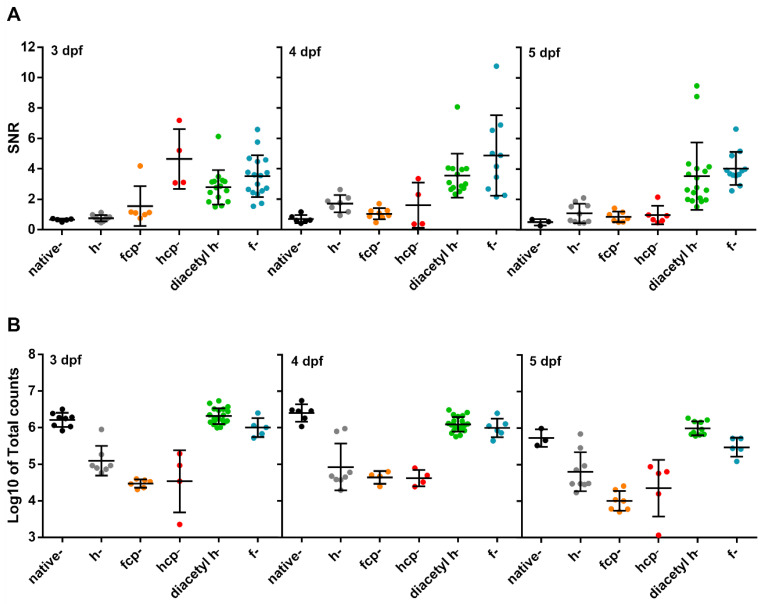
Figure 4 Test of CTZ analogues in 3, 4, and 5 dpf Tg(myl7:GA) zebrafish larvae. (A) SNR from larvae incubated with the CTZ analogues for 2 h with the aequorin reconstitution protocol. Images were acquired at 9 Hz. (Native-CTZ n = 5, 6, and 3; h-CTZ n = 10, 7, and 10; fcp-CTZ n = 6, 8, and 7; hcp-CTZ n = 4, 4, and 5; diacetyl h-CTZ n = 15, 14, and 18; and f-CTZ n = 17, 10, and 12; for 3, 4, and 5 dpf, respectively). Data are shown as mean ± SD. (B) Total counts released by the addition of 5% Triton X-100 in larvae incubated with the CTZ analogues for 2 h. (Native-CTZ n = 8, 6, and 3; h-CTZ n = 7, 8, and 9; fcp-CTZ n = 6, 4, and 7; hcp-CTZ n = 4, 4, and 5; diacetyl h-CTZ n = 19, 21, and 10; and f-CTZ n = 5, 6, and 5; for 3, 4, and 5 dpf, respectively). Data are shown as mean ± SD of Log10 of total counts.