
- Title
-
Transcriptome profile of the sinoatrial ring reveals conserved and novel genetic programs of the zebrafish pacemaker
- Authors
- Minhas, R., Loeffler-Wirth, H., Siddiqui, Y.H., Obrębski, T., Vashisht, S., Nahia, K.A., Paterek, A., Brzozowska, A., Bugajski, L., Piwocka, K., Korzh, V., Binder, H., Winata, C.L.
- Source
- Full text @ BMC Genomics
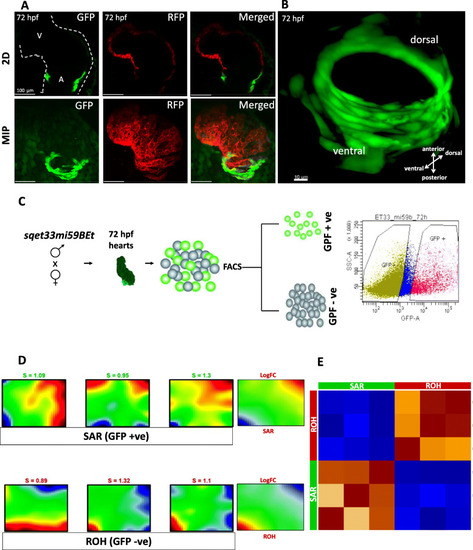
Morphological and transcriptional characterization of the zebrafish SAR. A In vivo confocal imaging of double transgenic sqet33mi59BEt x Tg (myl7:dsRed). B 3D reconstruction of the EGFP expression domain in the SAR at 72hpf. Individual channel signal threshold levels were adjusted for better visibility. C Schematic showing the strategy of in-cross of sqet33mi59BEt (preferably homozygous) to collect the GFP fluorescent embryonic hearts at 72 hpf followed by FACS sorting to GFP+ (SAR) and GFP- (rest of the heart). D Expression portraits of RNA-Seq data (dark red: strong overexpression, yellow and green colors: intermediate levels with low or no differential expression, dark blue: strong underexpression) showing the overexpression of metagenes in SAR (top panel) and the rest of the heart (bottom panel). The right-most portrait is the average of the three individual replicates of SAR and ROH, respectively. The indicated S-Value (silhouette value) is a measure of how similar an object is to its own cluster (cohesion) compared to other clusters (separation). E Pairwise Pearson’s correlation map between the replicates of SAR and the rest of the heart. 2D, 2-dimensional; MIP, maximum intensity projection EXPRESSION / LABELING:
|
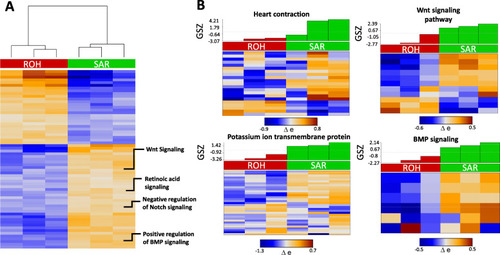
GO terms enriched among SAR overexpressed genes. A Functional annotation heatmap showing differentially expressed GO terms enriched in SAR (p < 0.01). B Heat map showing the expression pattern of genes related to heart contraction, potassium ion transport membrane protein, Wnt and BMP signalling in SAR |
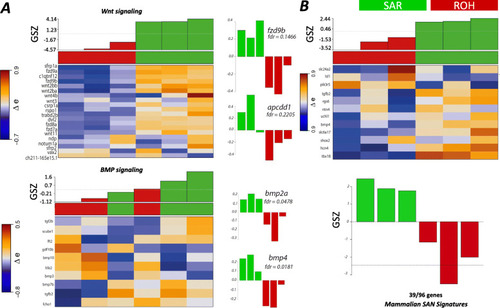
Molecular signatures and signalling pathways of SAR correlate with those in the mammalian SAN. A Heatmap showing the expression of components of Wnt/β-catenin and BMP signalling genes reported in [30] in SAN and ROH. Histograms of expression of the some of the key genes in both pathways are shown to indicate a gene-specific difference in the two sample sets. B Heatmap showing the expression of mammalian SAN genes reported in Vedantham et al. (2015) that have been compared with our SAR and ROH data set. A total of 39 out of 96 genes among the mammalian signature genes were overexpressed in our dataset |
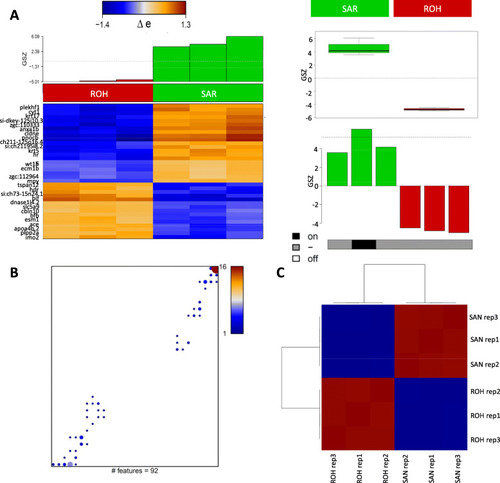
Genes overexpressed in SAR and ROH. A Genes differentially expressed between SAR and ROH were identified based on FDR (false discovery rate) < 0.1 comprising 92 genes (51 + / 46 -) with p-values < 0.0001. The boxplot and barplot show average expression of those genes in the samples and in the cell populations, respectively. The heatmap shows 92 genes deviating more than one standard deviation from average expression. B Mapping of differentially expressed genes into the SOM grid: Number of genes in the metagenes is color-coded (maroon> red> blue) with white areas representing metagenes not containing any of the 92 DE genes (FDR < 0.1). C Pairwise Pearson’s correlation map between the replicates of SAR and ROH based on the 92 differential genes only. Contrast between the two cell populations is enhanced as expected (compare to Fig. 1E). Red color represents 3 samples of sinoatrial ring while blue color indicates 3 sample of rest of the heart. SAR; Sinoatrial ring, ROH; rest of the heart |
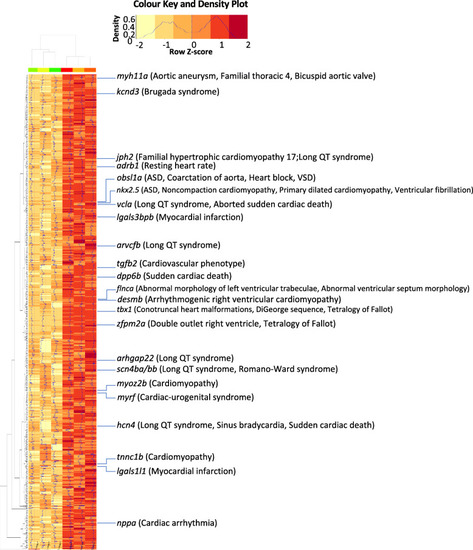
Orthologs of the SAR-overexpressed genes linked to human congenital heart diseases. Heatmap showing SAR-overexpressed genes whose human orthologues are associated with congenital heart diseases according to ClinVar phenotype entries |
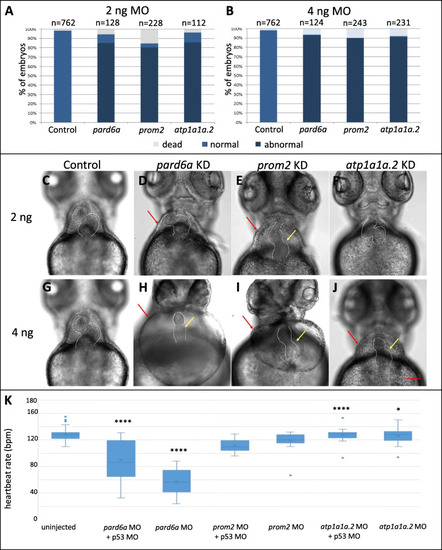
Morpholino mediated knockdown of three SAR-overexpressed candidate genes. A-H Heart morphology of control larvae and injected with 2 and 4 ng gene-specific morpholino against pard6a, prom2, and atp1a1a.2 after 72 hpf. Red arrows indicate pericardial edema, yellow arrows indicate a failure in heart looping. I-J Percentage of morphological defects observed as a result of 2 and 4 ng of MO injections, showing dose-dependent effect. Scale bar: 50 μm. K Distribution of average heartbeat rate (in beats per minute, bpm) assayed in 72 hpf larvae as a result of knockdown with 2 ng or 4 ng of MO against pard6a, prom2, and atp1a1a.2. “*” indicates that the difference in heartbeat rate compared to that of control (uninjected) group was statistically significant. Table shows average heartbeat rate and Student’s T-tested p-value PHENOTYPE:
|

ZFIN is incorporating published figure images and captions as part of an ongoing project. Figures from some publications have not yet been curated, or are not available for display because of copyright restrictions. EXPRESSION / LABELING:
|