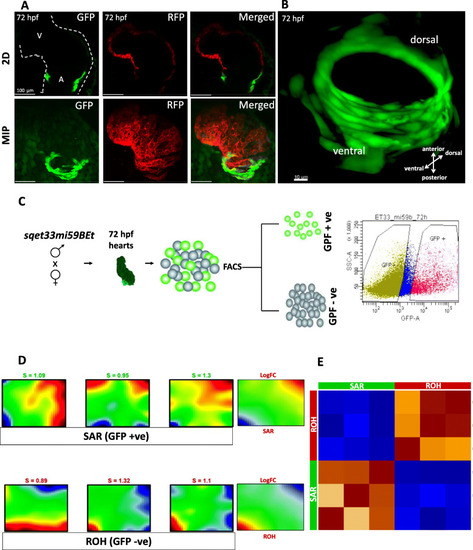
Morphological and transcriptional characterization of the zebrafish SAR. A In vivo confocal imaging of double transgenic sqet33mi59BEt x Tg (myl7:dsRed). B 3D reconstruction of the EGFP expression domain in the SAR at 72hpf. Individual channel signal threshold levels were adjusted for better visibility. C Schematic showing the strategy of in-cross of sqet33mi59BEt (preferably homozygous) to collect the GFP fluorescent embryonic hearts at 72 hpf followed by FACS sorting to GFP+ (SAR) and GFP- (rest of the heart). D Expression portraits of RNA-Seq data (dark red: strong overexpression, yellow and green colors: intermediate levels with low or no differential expression, dark blue: strong underexpression) showing the overexpression of metagenes in SAR (top panel) and the rest of the heart (bottom panel). The right-most portrait is the average of the three individual replicates of SAR and ROH, respectively. The indicated S-Value (silhouette value) is a measure of how similar an object is to its own cluster (cohesion) compared to other clusters (separation). E Pairwise Pearson’s correlation map between the replicates of SAR and the rest of the heart. 2D, 2-dimensional; MIP, maximum intensity projection
|
