
- Title
-
Nitazoxanide induced myocardial injury in zebrafish embryos by activating oxidative stress response
- Authors
- Gong, F., Shen, T., Zhang, J., Wang, X., Fan, G., Che, X., Xu, Z., Jia, K., Huang, Y., Li, X., Lu, H.
- Source
- Full text @ J. Cell. Mol. Med.
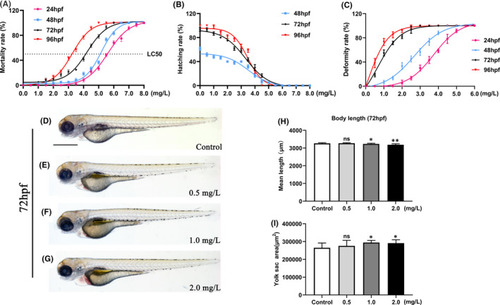
NTZ exposure induced developmental abnormalities in zebrafish embryos. Live zebrafish embryos were exposed to vehicle control (0.1% DMSO) or NTZ at various concentrations (0, 0.5, 1.0, 2.0, 3.0, 4.0, 5.0, 6.0, 7.0 and 8.0 mg/L) at 6 hpf. Statistics of (A) mortality, (B) hatching rate and (C) embryo malformation rate are shown. (D–G) Representative images of embryo morphology at 72 hpf. (H) The body length of the embryo at 72 hpf. (I) The yolk area of the embryo at 72 hpf. Note: |
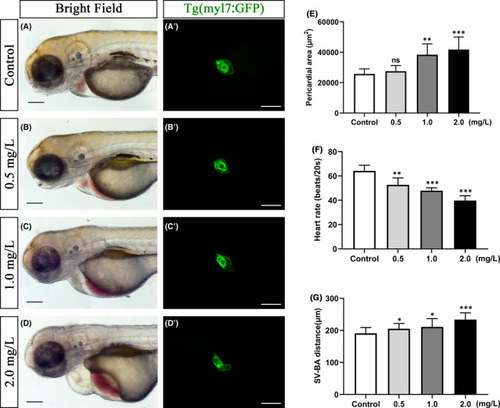
Toxic effect of NTZ exposure on embryonic heart of zebrafish. Live zebrafish embryos were exposed to vehicle control (0.1% DMSO) or NTZ at varying concentrations (0, 0.5, 1.0 and 2.0 mg/L) at 6 hpf and were observed at 72 hpf. (A–B) Enlarged high-resolution images of the embryonic heart area in zebrafish under white light. (A'–D’) Tg (myl7: GFP) diastolic heart imaged in zebrafish embryos in vivo. Quantification of cardiac shape and function (E) pericardial area (μm2), (F) heart rate (beats/20 seconds) and (G) SV-BA distance (μm2). Note: n = 50 larvae per group. Scale bar: 100 μm in panels a–d, a'–d’). The data were presented as the mean ±standard deviation. *p < 0.05; **p < 0.01 and ***p < 0.001 |
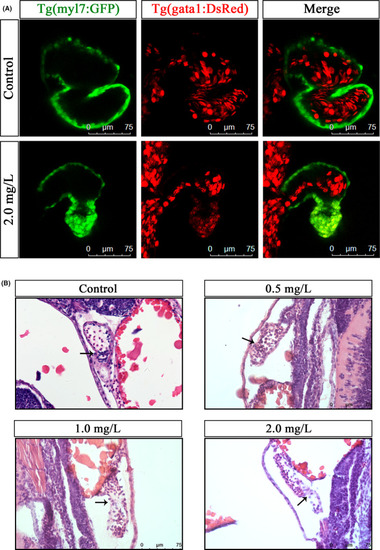
NTZ exposure reduced the pumping efficiency of the embryonic heart and severely altered the heart tissue morphology in zebrafish. (A) Heart pumping imaging of Tg (myl7: GFP) and Tg (gata1: DsRed) double transgenic zebrafish embryos. (B) Representative images of Haematoxylin and eosin staining of 72 hpf zebrafish embryos treated with different concentrations of NTZ. Note: The black arrow indicates the heart valve. Scale bar: 75 μm in panels a and b |
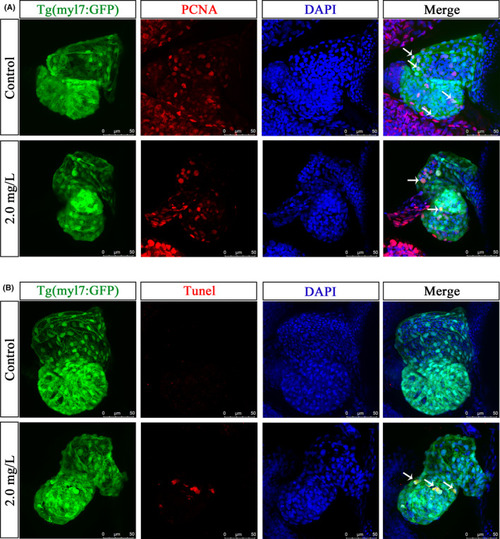
NTZ affected the proliferation of cardiomyocytes and induced apoptosis. Live Tg (myl7: GFP) zebrafish embryos were exposed to vehicle control (0.1% DMSO) or 2.0 mg/L NTZ at 6 hpf. The samples were taken at 72 hpf. (A) Representative images of fluorescence staining of PCNA showed proliferating cells. The white arrows indicate positive signals of proliferating cardiomyocytes. (B) Representative images of TUNEL staining showing apoptotic cells. The white arrow indicates a positive signal of apoptotic cardiomyocytes. Scale bar: 50 μm in panels a and b |
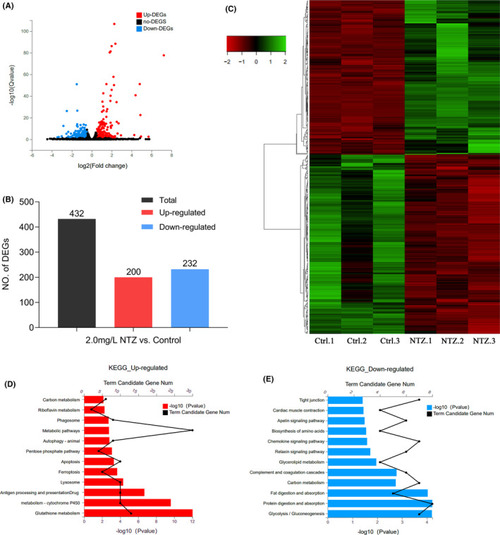
Application of RNA-Seq to identify DEGs followed by KEGG analysis. (A) Volcano map showing DEGs identified by RNA-sequencing. Red dots represent genes that were significantly upregulated, and blue dots represent genes that were significantly downregulated. The X-axis represents the difference multiple value, and the Y-axis represents the significance value. (B) Statistics of the 432 DEGs comprising 200 upregulated genes and 232 downregulated genes. (C) Hierarchical cluster analysis of DEGs in zebrafish embryos. Red represents genes that were significantly downregulated, while green represents genes that were significantly upregulated. (D) KEGG analysis of upregulated DEGs. (E) KEGG analysis of downregulated DEGs. In all analyses, the X-axis represents the enrichment significance (p-value); the Y-axis is the KEGG pathway, and the black dots represent the number of genes enriched on a certain KEGG pathway. Each group shows the top 12 items |
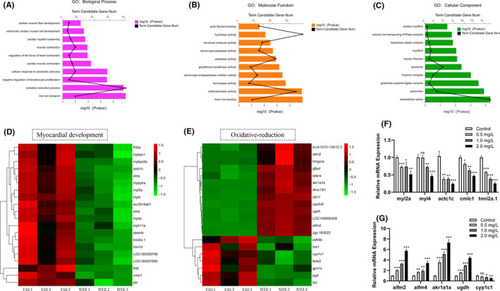
Application of RNA‐Seq for functional analysis of DEGs. (A) After NTZ exposure, the biological processes of zebrafish embryos that were significantly enriched in the GO analysis were identified. (B) After NTZ exposure, the molecular functions of zebrafish embryos significantly enhanced in the GO analysis were identified. (c) After NTZ exposure, the cell composition category was significantly enriched in the GO analysis of zebrafish embryos. In all analyses, the X‐axis represents the enrichment significance ( |
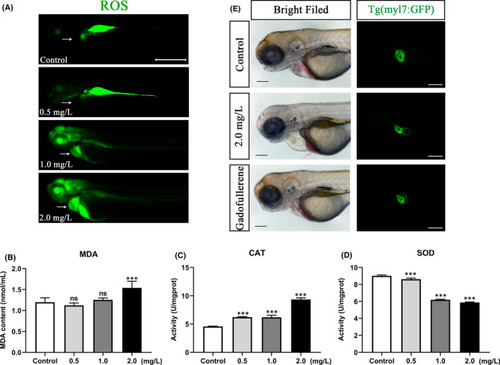
NTZ exposure caused excessive oxidative stress in zebrafish embryos. (A) ROS fluorescence distribution visualized in zebrafish embryos exposed to different concentrations of NTZ at 72 hpf. (B) MDA content, (C) CAT activity and (D) SOD activity of zebrafish embryos exposed to different concentrations of NTZ at 72 hpf. (E) Antioxidant GFNPs alleviated the cardiotoxic effects of NTZ. The data were presented as the mean ±standard deviation. ***p < 0.001 |