IMAGE

FIGURE 6

ID
ZDB-IMAGE-211025-82
Source
Figures for Gong et al., 2021
Image
Figure Caption

FIGURE 6

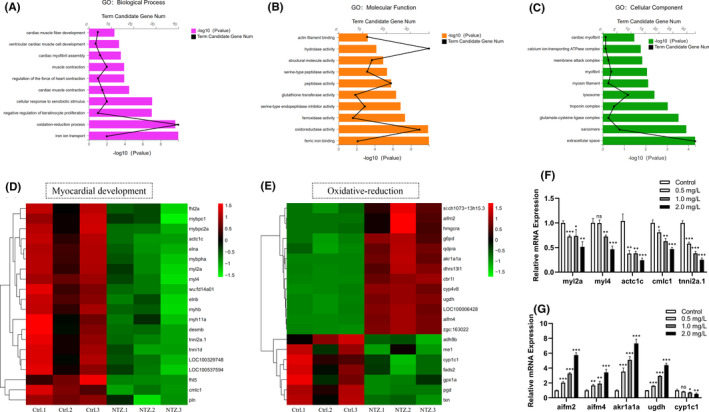
Application of RNA‐Seq for functional analysis of DEGs. (A) After NTZ exposure, the biological processes of zebrafish embryos that were significantly enriched in the GO analysis were identified. (B) After NTZ exposure, the molecular functions of zebrafish embryos significantly enhanced in the GO analysis were identified. (c) After NTZ exposure, the cell composition category was significantly enriched in the GO analysis of zebrafish embryos. In all analyses, the X‐axis represents the enrichment significance (p‐value). The Y‐axis lists the GO term, and the black dots represent the number of genes enriched in each GO term. Each group shows the top 10 items. (D) The heat map shows that the development of the myocardium was inhibited after NTZ exposure. (E) The heat map shows that oxidative stress has been activated after NTZ exposure. (F–G) Verification of differentially expressed genes by using qPCR. The expression levels of five randomly selected genes related to heart development and oxidative stress were confirmed. The data were presented as the mean ±standard deviation. *p < 0.05; **p < 0.01 and ***p < 0.001

Acknowledgments
This image is the copyrighted work of the attributed author or publisher, and ZFIN has permission only to display this image to its users. Additional permissions should be obtained from the applicable author or publisher of the image. Full text @ J. Cell. Mol. Med.