
FIGURE 5
- ID
- ZDB-FIG-211025-65
- Publication
- Gong et al., 2021 - Nitazoxanide induced myocardial injury in zebrafish embryos by activating oxidative stress response
- Other Figures
- All Figure Page
- Back to All Figure Page
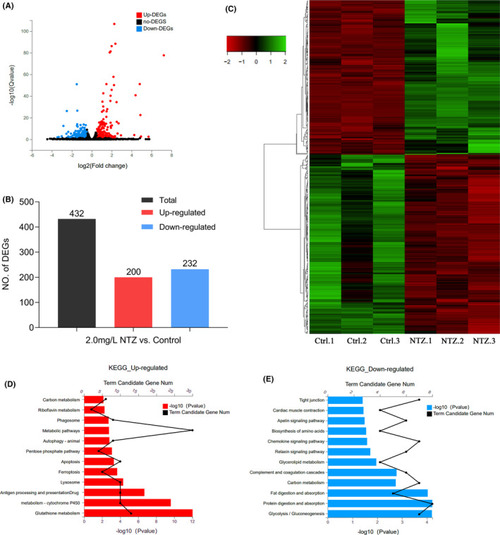
Application of RNA-Seq to identify DEGs followed by KEGG analysis. (A) Volcano map showing DEGs identified by RNA-sequencing. Red dots represent genes that were significantly upregulated, and blue dots represent genes that were significantly downregulated. The X-axis represents the difference multiple value, and the Y-axis represents the significance value. (B) Statistics of the 432 DEGs comprising 200 upregulated genes and 232 downregulated genes. (C) Hierarchical cluster analysis of DEGs in zebrafish embryos. Red represents genes that were significantly downregulated, while green represents genes that were significantly upregulated. (D) KEGG analysis of upregulated DEGs. (E) KEGG analysis of downregulated DEGs. In all analyses, the X-axis represents the enrichment significance (p-value); the Y-axis is the KEGG pathway, and the black dots represent the number of genes enriched on a certain KEGG pathway. Each group shows the top 12 items |