
- Title
-
TRIM28 Selective Nanobody Reduces Glioblastoma Stem Cell Invasion
- Authors
- Porčnik, A., Novak, M., Breznik, B., Majc, B., Hrastar, B., Šamec, N., Zottel, A., Jovčevska, I., Vittori, M., Rotter, A., Komel, R., Lah Turnšek, T.
- Source
- Full text @ Molecules
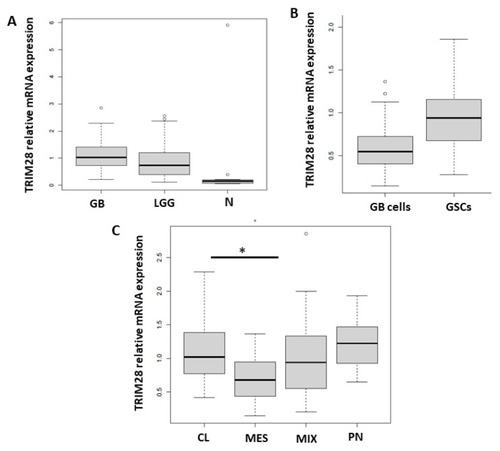
TRIM28 gene expression in glioma tissues, GB cells and GB tissue subtypes. TRIM28 mRNA expression levels were determined by RT-qPCR in (A) GB (n = 95), LGG (glioma I–II, n = 19) and non-cancerous brain tissues (N, n = 16). (B) Primary differentiated GB cells (GB cells, n = 18) and GSCs (n = 6), and (C) CL (n = 24), PN (n = 8), MES (n = 4) and MIX (n = 59) GB tissue subtypes. mRNA values were normalized to housekeeping genes HPRT1 and GAPDH and analysed with quantGenius software [41]. Statistical analysis was performed in R, using analysis of variance to determine the homogeneity of variance between glioma tissues, primary and stem cells, and subtypes. Tukey’s post hoc test was then used to for multiple comparison between groups with significance levels (* p < 0.05). Different Y-axis scales are presented. |
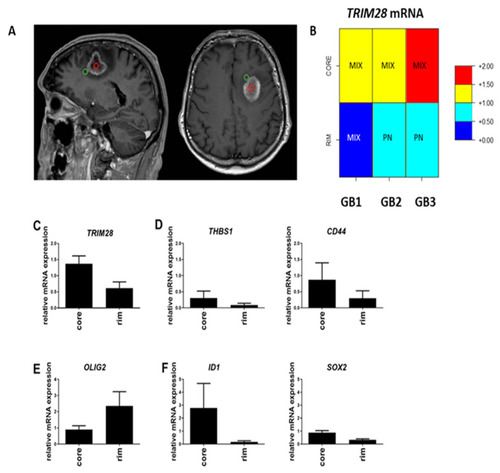
Gene expression analysis of the GB core versus rim areas. (A) T1-weighted MRI scans of a representative patient GB3, with multi-region surgical sampling. Regions include central enhancing core in red circle and rim area as the invasive edge in green circle, defined by the 5-aminolevulinicacid (5ALA) fluorescence positive area beyond the enhancement, according to the image guidance navigation system. (B) GB subtype analysis of core and rim areas in three GB samples (GB1, GB2 and GB3). High or low expression of TRIM28 within those areas is scaled in colours, representing relative expression (normalisation) of mRNA levels of TRIM28 gene vs. the mean of two housekeeping genes, HPRT1 and GAPDH. The red colour in Figure 2B visualizes relatively higher levels of TRIM28 mRNA expression (>1), while the blue colour indicates lower TRIM28 mRNA values (<1), and these are clearly separated in the rim vs. core tissues, shown separately in each GB1, GB2 and GB3 samples. (C) Expression of TRIM28, (D) MES subtype genes (THBS1, CD44), (E) PN subtype gene OLIG2, and (F) GSC genes (ID1, and SOX2), were analysed in GB tissue core and rim areas, by RT-qPCR. mRNA values were normalized to housekeeping genes HPRT1 and GAPDH and analysed with quantGenius software [42]. Presented results are the mean ± S.D. of three GB samples. |
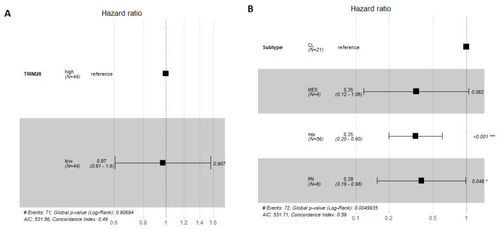
TRIM28 is not a prognostic marker of GB patient survival. Forest plot for Cox proportional hazards model showing the association between TRIM28 expression levels in GB and GB subtypes and survival, with confidence interval of 95% CI. (A) TRIM28 high or low expression, within GB group (n = 88). (B) TRIM28 high or low expression, within CL, PN, MES and MIX GB subtypes, has no effect on prognosis of GB patient survival. CL GB subtype is set as a reference. * p < 0.05, *** p < 0.001. |
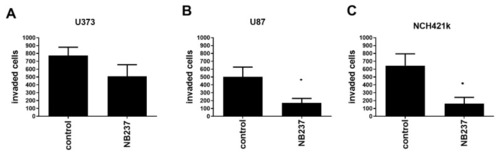
Effect of TRIM28 nanobody NB237 on invasion of GB cells. (A,B) GB cells, U373 and U87, at 10,000 cells/insert; and (C) GSCs NCH421k at 80,000 cells/insert, were seeded in the upper compartment in serum-free medium alone or in combination with TRIM28 nanobody (final concentration 100 µg/mL). The cells that invaded the Matrigel after 48 h were stained with 0.1% crystal violet and counted using inverted microscope. Each value represents mean ± S.D. (Three biological replicates). Statistical analyses was performed using GraphPad Prism software, using t-test, * p < 0.05, vs. control group. |
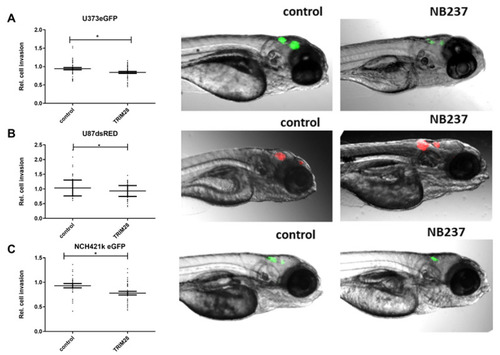
In vivo imaging of GB cell and GSC invasion in the brain of zebrafish embryos. Embryos 72 h after the xenotransplantation of ( |