IMAGE

Figure 5

ID
ZDB-IMAGE-210915-74
Source
Figures for Porčnik et al., 2021
Image
Figure Caption

Figure 5

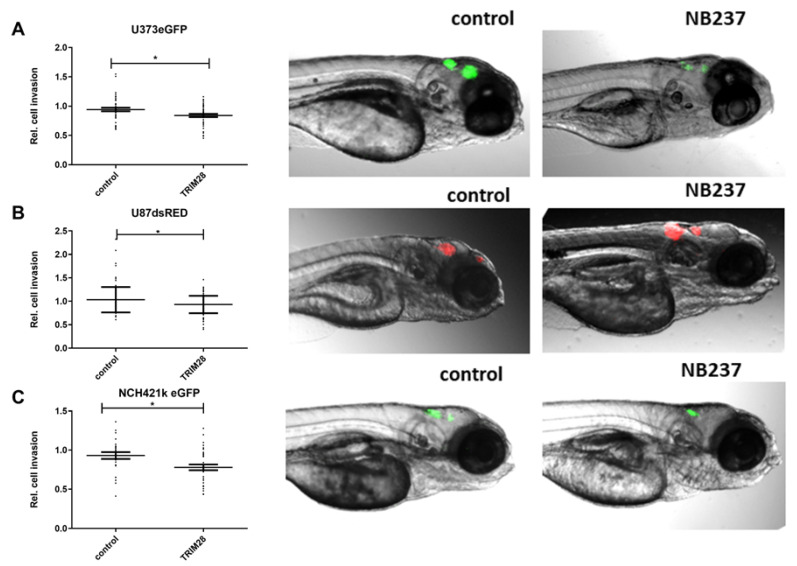
In vivo imaging of GB cell and GSC invasion in the brain of zebrafish embryos. Embryos 72 h after the xenotransplantation of (A) U373eGFP, (B) U87DsRed and (C) NCH421k eGFPcells in the brain (visible as red and green fluorescence) without (control) or with the TRIM28 nanobody NB237. Data are shown as means ± S.D., dots on graphs (AC) represent each embryo. GB xenograft diameter at 72 h was normalized to GB xenograft diameter at 24 h after xenotransplantation to determine the relative cell invasion. Number of embryos in control and with NB237 in the experiment with U373 n = 37–50, U87 n = 94–108, NCH421k n = 13–38. Statistical analyses were performed using GraphPad Prism software, using Mann–Whitney test, * p < 0.05, vs. control group.

Acknowledgments
This image is the copyrighted work of the attributed author or publisher, and ZFIN has permission only to display this image to its users. Additional permissions should be obtained from the applicable author or publisher of the image. Full text @ Molecules