
|
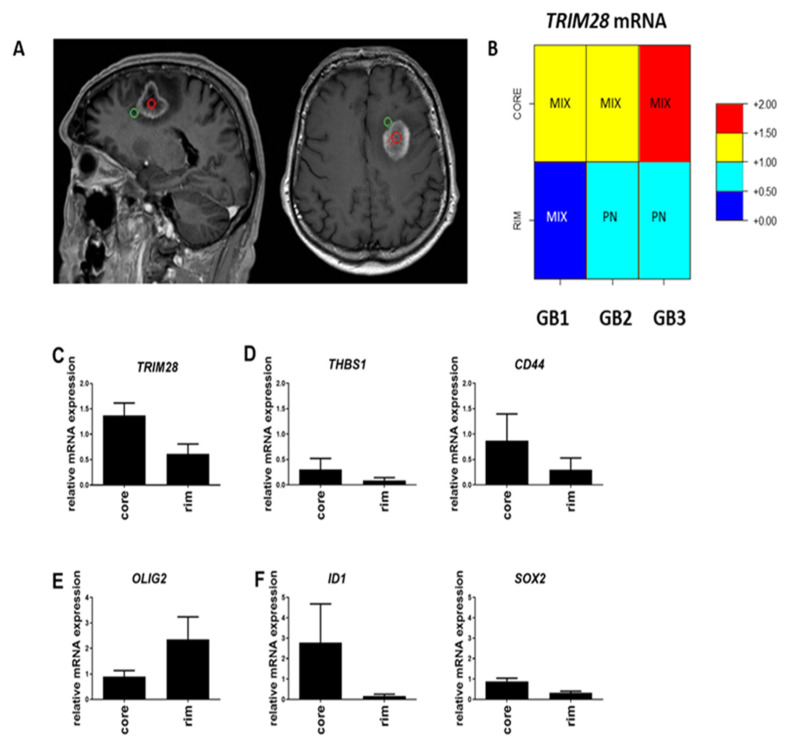
Figure 2
Gene expression analysis of the GB core versus rim areas. (A) T1-weighted MRI scans of a representative patient GB3, with multi-region surgical sampling. Regions include central enhancing core in red circle and rim area as the invasive edge in green circle, defined by the 5-aminolevulinicacid (5ALA) fluorescence positive area beyond the enhancement, according to the image guidance navigation system. (B) GB subtype analysis of core and rim areas in three GB samples (GB1, GB2 and GB3). High or low expression of TRIM28 within those areas is scaled in colours, representing relative expression (normalisation) of mRNA levels of TRIM28 gene vs. the mean of two housekeeping genes, HPRT1 and GAPDH. The red colour in Figure 2B visualizes relatively higher levels of TRIM28 mRNA expression (>1), while the blue colour indicates lower TRIM28 mRNA values (<1), and these are clearly separated in the rim vs. core tissues, shown separately in each GB1, GB2 and GB3 samples. (C) Expression of TRIM28, (D) MES subtype genes (THBS1, CD44), (E) PN subtype gene OLIG2, and (F) GSC genes (ID1, and SOX2), were analysed in GB tissue core and rim areas, by RT-qPCR. mRNA values were normalized to housekeeping genes HPRT1 and GAPDH and analysed with quantGenius software [42]. Presented results are the mean ± S.D. of three GB samples.