
- Title
-
Is impaired energy production a novel insight into the pathogenesis of pyridoxine-dependent epilepsy due to biallelic variants in ALDH7A1?
- Authors
- Minenkova, A., Jansen, E.E.W., Cameron, J., Barto, R., Hurd, T., MacNeil, L., Salomons, G.S., Mercimek-Andrews, S.
- Source
- Full text @ PLoS One
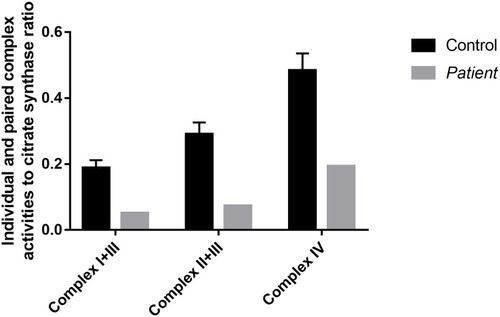
Electron transport chain paired and individual complexes in muscle biopsy specimen are depicted, which shows decreased paired and individual complex activities in Patient 1 compared to controls. |
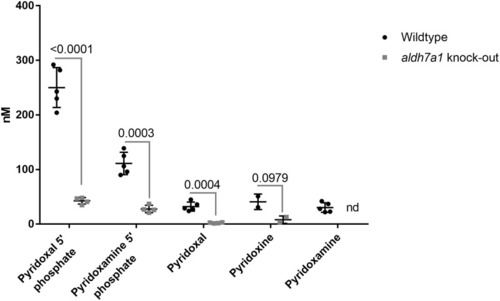
Vitamin B6 vitamers levels are reduced in aldh7a1 homozygous knock-out embryos relative to the wildtype. It is shown in a scatterplot of quantification of the levels of vitamin B6 vitamers in aldh7a1 homozygous knock-out zebrafish relative to the wildtype as measured by LC-MS. The graph demonstrates decreased levels of vitamin B6 vitamers in aldh7a1 knock-out 11 dpf embryos (aldh7a1 knock-out, grey squares) relative to the age-matched wildtype control embryos (Wildtype, black circles). Each dot represents metabolite data collected from 20 embryos. For a single data point of homozygous aldh7a1 knock-out zebrafish, only 16 embryos were available, so that data point was excluded from the analysis. nd, not detectable–the levels of metabolites could not be measured. p values were calculated by unpaired student t-test for multiple measurements followed by Holm-Sadak correction for multiple analysis. Error bars, SD. PHENOTYPE:
|
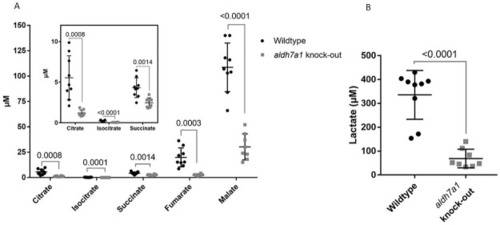
TCA cycle metabolite levels are reduced in aldh7a1 knock-out zebrafish embryos. Scatterplot of quantification of the TCA cycle metabolite levels decreased in aldh7a1 11 dpf knock-out embryos (aldh7a1 knock-out, grey squares) relative to the wildtype age-matched controls (Wildtype, black circles), as measured by LC-MS/MS. Each dot represents metabolite data collected from 20 embryos. p values were calculated by unpaired student t-test for multiple measurements followed by Holm-Sadak correction for multiple analysis. Error bars, SD. |
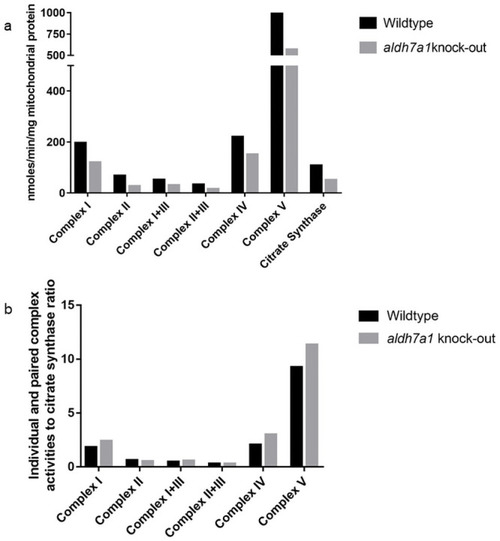
Electron transport chain enzyme activities are reduced in |
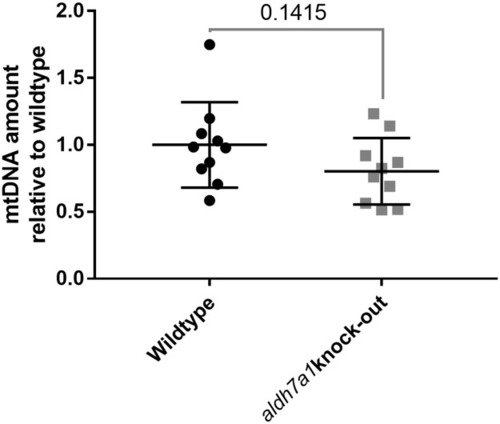
qPCR graph of mtDNA amount from wildtype (Wildtype, black circles) and aldh7a1 homozygous knock-out (aldh7a1 knock-out, grey squares) zebrafish embryos, demonstrating only a slight reduction in mtDNA copy number in knock-out relative to the wildtype embryos. Each dot represents DNA extracted from 5 embryos. The amounts of mtDNA from knock-out and wildtype embryos were normalized to the average mtDNA amount from the wildtype embryos. p value is calculated by an unpaired two-tailed student t-test. Error bars, mean and SD. PHENOTYPE:
|
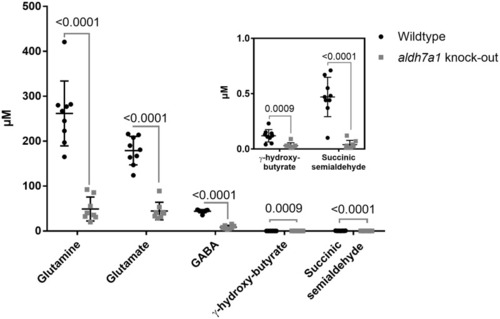
The levels of GABA metabolism reaction intermediates are reduced in aldh7a1 knock-out zebrafish embryos. It is shown in a scatterplot of quantification of the levels of GABA metabolism pathway metabolites, as measured by GC-MS and LC-MS/MS. The metabolite levels in 11 dpf aldh7a1 homozygous knock-out (aldh7a1 knock-out, grey squares) embryos are significantly decreased relative to the wildtype (Wildtype, black circles). Each dot represents metabolite data collected from 20 embryos. p values were calculated by unpaired student t-test for multiple measurements followed by Holm-Sadak correction for multiple analysis. Error bars, SD. |