IMAGE

Fig 5

ID
ZDB-IMAGE-210912-5
Source
Figures for Minenkova et al., 2021
Image
Figure Caption

Fig 5 A & B. Quantification of fold change in the electron transport chain enzyme activities in knock-out <italic toggle='yes'>aldh7a1</italic> 11 dpf embryos relative to the wildtype age-matched controls.

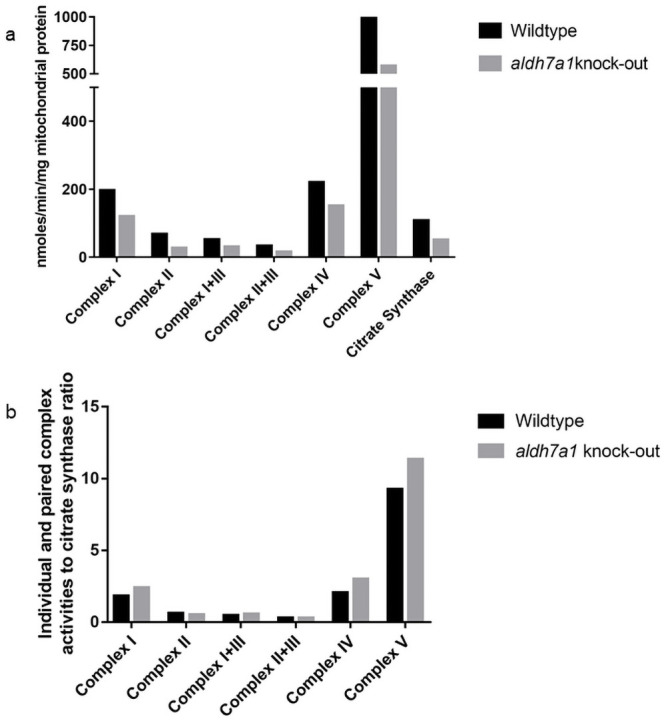
Electron transport chain enzyme activities are reduced in aldh7a1 knock-out zebrafish. 5A: individual and paired complexes and citrate synthase. 5B: ratio of individual and paired complexes to citrate synthase. Bar graph of the quantification of fold change in the electron transport chain enzyme activities in knock-out aldh7a1 11 dpf embryos (grey bars) relative to the wildtype age-matched controls (black bars). Each bar represents data collected from 300 embryos. The activity of each enzyme was measured in presumed homozygous 300 and 300 wildtype embryos. The values are depicted as enzyme activity in nmol/min/ mitochondrial protein mass normalized to the activity of citrate synthase (For further details please refer to Materials and Methods).

Figure Data
Acknowledgments
This image is the copyrighted work of the attributed author or publisher, and ZFIN has permission only to display this image to its users. Additional permissions should be obtained from the applicable author or publisher of the image. Full text @ PLoS One