
Image
|
Figure Caption
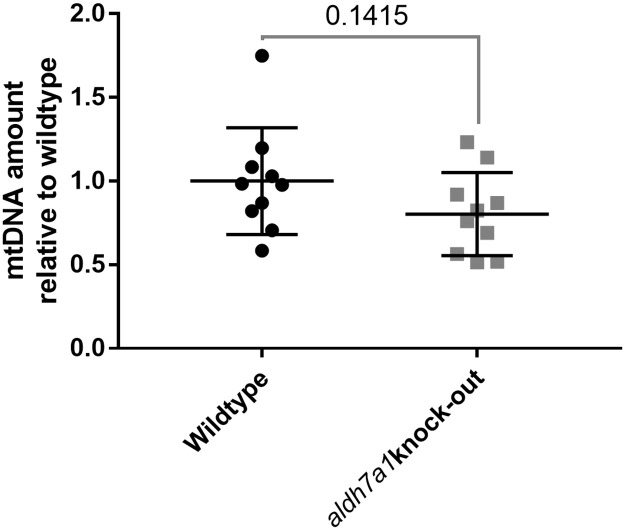
Fig 6
qPCR graph of mtDNA amount from wildtype (Wildtype, black circles) and aldh7a1 homozygous knock-out (aldh7a1 knock-out, grey squares) zebrafish embryos, demonstrating only a slight reduction in mtDNA copy number in knock-out relative to the wildtype embryos. Each dot represents DNA extracted from 5 embryos. The amounts of mtDNA from knock-out and wildtype embryos were normalized to the average mtDNA amount from the wildtype embryos. p value is calculated by an unpaired two-tailed student t-test. Error bars, mean and SD.
Figure Data
Acknowledgments
This image is the copyrighted work of the attributed author or publisher, and
ZFIN has permission only to display this image to its users.
Additional permissions should be obtained from the applicable author or publisher of the image.
Full text @ PLoS One