
FIGURE
Fig 4
- ID
- ZDB-FIG-210912-4
- Publication
- Minenkova et al., 2021 - Is impaired energy production a novel insight into the pathogenesis of pyridoxine-dependent epilepsy due to biallelic variants in ALDH7A1?
- Other Figures
- All Figure Page
- Back to All Figure Page
Fig 4
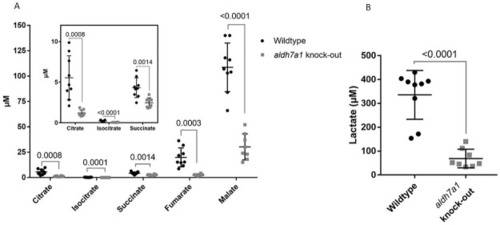
TCA cycle metabolite levels are reduced in aldh7a1 knock-out zebrafish embryos. Scatterplot of quantification of the TCA cycle metabolite levels decreased in aldh7a1 11 dpf knock-out embryos (aldh7a1 knock-out, grey squares) relative to the wildtype age-matched controls (Wildtype, black circles), as measured by LC-MS/MS. Each dot represents metabolite data collected from 20 embryos. p values were calculated by unpaired student t-test for multiple measurements followed by Holm-Sadak correction for multiple analysis. Error bars, SD. |
Expression Data
Expression Detail
Antibody Labeling
Phenotype Data
| Fish: | |
|---|---|
| Observed In: | |
| Stage: | Days 7-13 |
Phenotype Detail
Acknowledgments
This image is the copyrighted work of the attributed author or publisher, and
ZFIN has permission only to display this image to its users.
Additional permissions should be obtained from the applicable author or publisher of the image.
Full text @ PLoS One