
|
Fig. 3
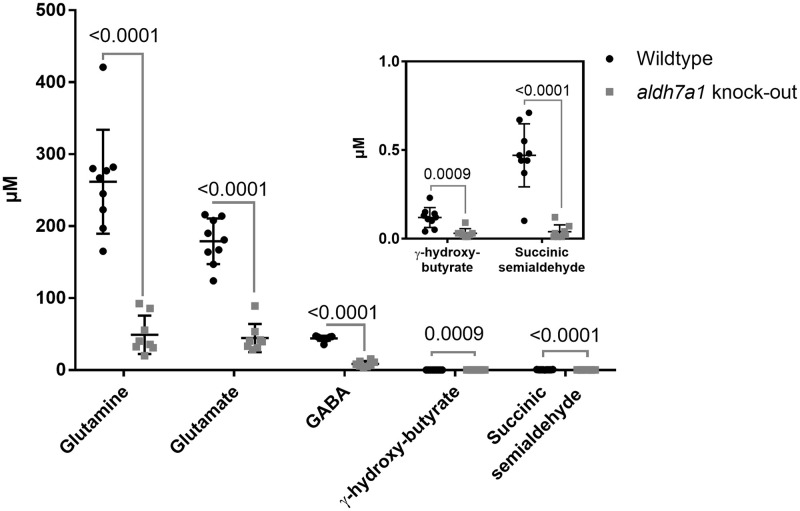
The levels of GABA metabolism reaction intermediates are reduced in aldh7a1 knock-out zebrafish embryos. It is shown in a scatterplot of quantification of the levels of GABA metabolism pathway metabolites, as measured by GC-MS and LC-MS/MS. The metabolite levels in 11 dpf aldh7a1 homozygous knock-out (aldh7a1 knock-out, grey squares) embryos are significantly decreased relative to the wildtype (Wildtype, black circles). Each dot represents metabolite data collected from 20 embryos. p values were calculated by unpaired student t-test for multiple measurements followed by Holm-Sadak correction for multiple analysis. Error bars, SD.