
- Title
-
Redundant mechanisms driven independently by RUNX1 and GATA2 for hematopoietic development
- Authors
- Bresciani, E., Carrington, B., Yu, K., Kim, E.M.K., Zhen, T., Guzman, V.S., Broadbridge, E., Bishop, K., Kirby, M., Harper, U., Wincovitch, S., Dell'Orso, S., Sartorelli, V., Sood, R., Liu, P.P.
- Source
- Full text @ Blood Adv
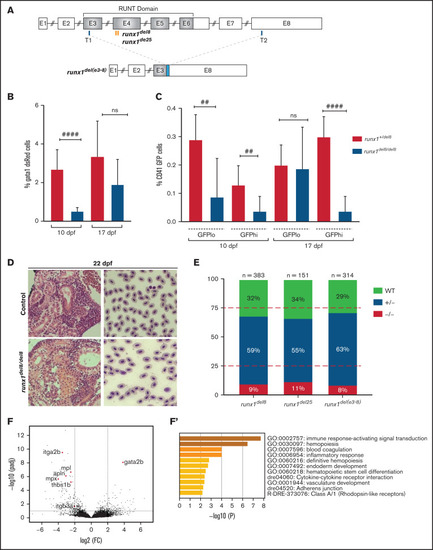
runx1−un mutants survive to adult and recover multilineage hematopoiesis. (A) Schematic representation of the runx1 gene showing the regions (orange bars) targeted with engineered TALENs that generated the runx1del8, runx1del25 mutant lines and the CRISPR targets, T1 and T2 (blue bars), used to generate the runx1del(e3-8) mutant line as shown in the lower panel. The cyan box in the lower panel indicates a 66-bp insertion between the 2 cut sites. Percentage of gata1:dsRed+ (B) and cd41:GFPlow or cd41:GFPhigh (C) in Tg(gata1:dsRed; cd41:GFP) runx1del8/del8 runx1+/del8 controls at 10 and 17 dpf analyzed by flow cytometry (##P < .01, ####P < .0001). (D) Kidney histology and blood smear of a representative 22 dpf runx1del8/del8 appear similar to a runx1+/del8 control sibling. (E) Stacked bar chart showing the percentage of adult runx1del/del8, runx1del2/del25, and runx1del(e3-8)/del(e3-8) recovered from inbred heterozygous parents; red dashed lines indicate the expected Mendelian ratio. (F) Volcano plot showing the differentially expressed genes in the kidneys between adult runx1−un and wild-type zebrafish. The red dots identify known hematopoietic markers for thrombocytes, myeloid cells, and HSCs that are differentially expressed at FC > 2 and Padj < .05. (F′) Gene ontology enrichment analysis results for panel F. |
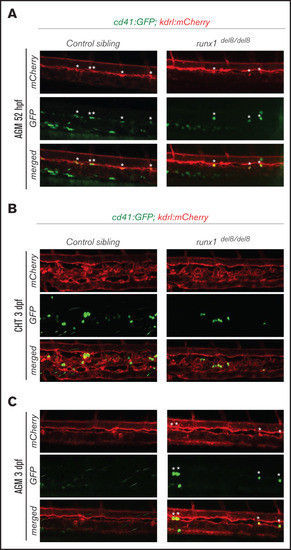
Development of cd41:GFP+ hematopoietic precursors in runx1del8/del8 AGM and CHT. (A) Snapshots of the AGM region of runx1del8/del8 and control sibling Tg(cd41:GFP); Tg(kdrl:mCherry) at 52 hours postfertilization (hpf), obtained from time-lapse recordings on a confocal microscope (supplemental Movies 1 and 2). cd41:GFP+ mCherry+ double-positive cells are indicated with white asterisks. (B-C) Live confocal imaging of the CHT (B) and AGM (C) regions in the Tg(cd41:GFP); (B) Tg(kdrl:mCherry) embryos at 3 dpf. cd41:GFP+ cells are found in the CHT. (C) Residual cd41:GFP+ cells (white asterisks) are still detectable in the AGM of runx1del8/del8. EXPRESSION / LABELING:
PHENOTYPE:
|
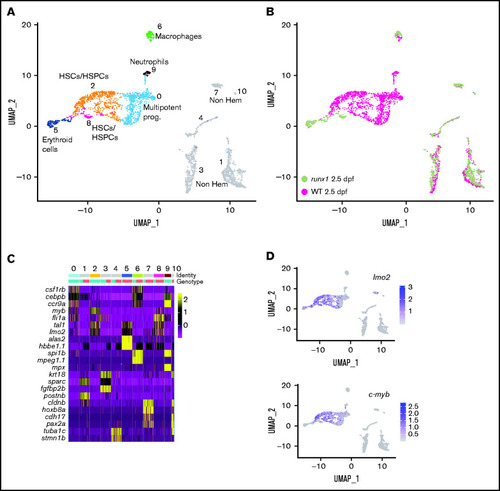
Single-cell gene expression profile of wild-type and runx1del8/de cd41:GFPlow hematopoietic precursors at 2.5 dpf. (A) UMAP of freshly FACS-isolated cd41:GFPlow cells from wild-type and runx1del8/del8 embryos at 2.5 dpf. Colored clusters represent hematopoietic cells; gray clusters are nonhematopoietic (based on expression profile). (B) UMAP depicting the genotypes of the cd41:GFPlow cells. Mint dots, wild type; magenta dots, runx1del8/del8. (C) Heat map depicting the expression of signature genes representative of different cell identities. The horizontal bars on the top correspond to the clusters identified in panel A (Identity) and show the distribution of the 2 genotypes (Genotype) across the clusters. One hundred representative cells per clusters are shown. (D) Feature plots depicting the expression level of the HSC markers c-myb and lmo2 (purple is high, gray is low). See also supplemental Figure 2 for additional scRNA-seq data from 2.5-dpf embryos. PHENOTYPE:
|
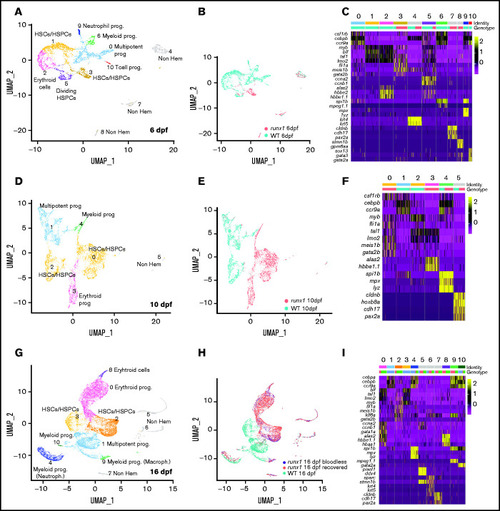
Single-cell analysis of wild-type and runx1del8/del8 cd41:GFPlow at 6, 10, and 16 dpf show only few overlapping populations. UMAP of freshly FACS-isolated cd41:GFPlow cells from wild-type and runx1del8/del8 embryos at 6 (A), 10 (D), and 16 dpf (G). Colored clusters represent hematopoietic cells; gray clusters are nonhematopoietic (based on expression profile). UMAP depicting the genotypes of the cd41:GFPlow cells at 6 (B), 10 (E), and 16 (H). Mint dots, wild type; magenta dots, runx1del8/del8 (B,E). At 16 dpf, mint dots represent wild type; magenta dots, runx1del8/del8 with circulating blood cells (recovered); blue dots, bloodless runx1del8/del8. (C,F,I) Heat maps depicting the expression of signature genes representative of different cell identities in each of the clusters identified, respectively, in panels A, D, and G. The horizontal bars on the top correspond to the clusters identified the correspondent UMAP (Identity) and show the distribution of the 2 genotypes (Genotype) across the clusters. One hundred representative cells per clusters are shown. See also supplemental Figures 3 and 4 for additional scRNA-seq data. EXPRESSION / LABELING:
PHENOTYPE:
|
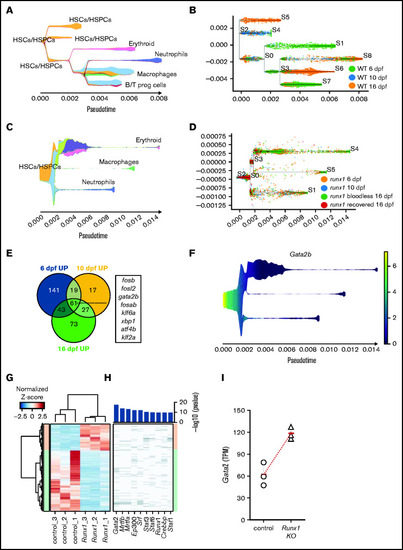
Gata2 is upregulated in the HSPCs of Runx1 zebrafish and mice knockouts. (A) Stream plot representing the pseudotime trajectory projection of wild-type cd41:GFPlow cells at 6, 10, and 16 dpf and their different identities. (B) Subway map depicting the distribution of wild-type cd41:GFPlow cells from different time points to the different branches. (C) Stream plot representing the pseudotime trajectory projection of runx1del8/del8 cd41:GFPlow cells at 6, 10, and 16 dpf and their different identities. (D) Subway map illustrating the contribution of runx1del8/del8 cd41:GFPlow at different time points to the different branches. (E) Venn diagram representing the number of upregulated genes in runx1del8/del8 HSC/HSPCs vs wild-type at 6, 10, and 16 dpf (Padj < .05, FC > 1.5). Sixty-one genes were commonly upregulated, of which 8 were transcription factors (listed). (F) Stream plot depicting the expression of gata2b in the runx1del8/del8 larval cd41-GFPlow pseudotime development (from panels C and D). See supplemental Figure 5 for additional analyses of hematopoietic differentiation trajectories in runx1del8/del8 and wild-type larvae at 6, 10, and 16 dpf. (G) Unsupervised hierarchical clustering of wild-type and Runx1−un RNAseq samples and heat map depicting the differentially expressed genes between wild-type and Runx1−un c-Kit+ HSPCs (940 downregulated and 414 upregulated in the Runx1−un; Padj < .05, FC > 2). (H) Top transcription factors enriched for regulating the differentially expressed genes. The x axis of the heatmap lists the transcription factors, and the y axis shows the DE genes sorted in the same order of the y axis in panel B. Bar plot on the top showed the enrichment P values for each transcription factor. (I) Gata2 expression in c-kit+ bone marrow cells in control and Runx1−/− mice, measured by RNA-seq. Round and triangle points mark transcripts per kilobase million values of each mouse in control and Runx1−/− mice, respectively. Red ticks mark the average transcripts per kilobase million value. See supplemental Figure 6 for additional data on Gata2 expression in Runx1 conditional knockout mice. EXPRESSION / LABELING:
PHENOTYPE:
|
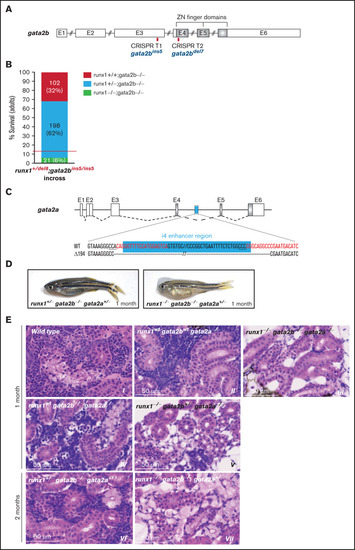
gata2b and gata2a are required for the development of definitive hematopoiesis in runx1 mutants. (A) Schematic representation of the gata2b gene showing the CRISPR targets T1 and T2 (red bars) used to generate the gata2bins5 and the gata2bdel7 mutant lines. (B) Survival of adult runx1del8/gata2bins5 double mutants obtained from the incross of runx1+/del8; gata2bins5/ins5 fish. Red dashed lines indicate the expected ratio of runx1−un recovery based on our previous experimental data (Figure 1E). Each bar segment shows the percentage and number of fish recovered for each genotype. (C) Schematic representation of gata2a genomic structure. The cyan box represents the 150-bp i4 enhancer that was removed using 2 CRISPR guides (red letters). (D) Photographs of representative 1-month-old runx1+/−gata2b−atgata2a+/− and runx1−ungata2b−atgata2a−at fish, with the latter more pale and smaller than the former. (E) Histologic analysis of kidney marrow of triple mutants runx1del8;gata2bins5;gata2ai4del1 at 1 or 2 months. Kidneys from runx1 wild-type and runx1+/− fish (panels II, IV, and VI) are similar to the kidney from the wild-type control (panel I) with marrows populated by blood progenitors. Kidneys from runx1del8/del8 fish with gata2b−atgata2a−at (III), gata2b+/−gata2a−at (V), or gata2b+/−gata2a+/− (VII) completely lack blood progenitors. See supplemental Figure 7 for additional characterizations of the zebrafish gata2b and gata2a mutants. PHENOTYPE:
|