
Figure 1.
|
Figure 1.
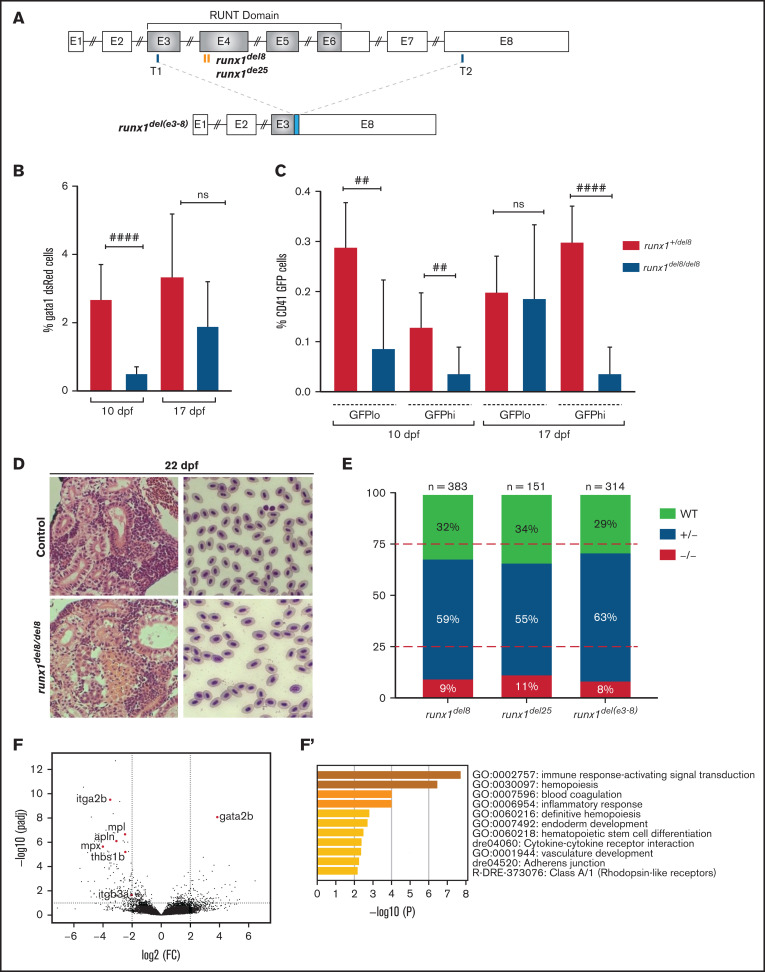
runx1−un mutants survive to adult and recover multilineage hematopoiesis. (A) Schematic representation of the runx1 gene showing the regions (orange bars) targeted with engineered TALENs that generated the runx1del8, runx1del25 mutant lines and the CRISPR targets, T1 and T2 (blue bars), used to generate the runx1del(e3-8) mutant line as shown in the lower panel. The cyan box in the lower panel indicates a 66-bp insertion between the 2 cut sites. Percentage of gata1:dsRed+ (B) and cd41:GFPlow or cd41:GFPhigh (C) in Tg(gata1:dsRed; cd41:GFP) runx1del8/del8 runx1+/del8 controls at 10 and 17 dpf analyzed by flow cytometry (##P < .01, ####P < .0001). (D) Kidney histology and blood smear of a representative 22 dpf runx1del8/del8 appear similar to a runx1+/del8 control sibling. (E) Stacked bar chart showing the percentage of adult runx1del/del8, runx1del2/del25, and runx1del(e3-8)/del(e3-8) recovered from inbred heterozygous parents; red dashed lines indicate the expected Mendelian ratio. (F) Volcano plot showing the differentially expressed genes in the kidneys between adult runx1−un and wild-type zebrafish. The red dots identify known hematopoietic markers for thrombocytes, myeloid cells, and HSCs that are differentially expressed at FC > 2 and Padj < .05. (F′) Gene ontology enrichment analysis results for panel F.